What ARE Net Drug Prices in Medicaid? Explore Texas’ Best Estimate of 340B Ceiling prices
One of the challenges with drug affordability in the U.S. is that we cannot agree on what a drug’s price actually should be. The relatively simple question of “what should a drug cost?” is surprisingly nuanced in the United States due to a variety of drug reference prices (or pricing benchmarks), which our system relies upon to pay for drugs. For those of us that spend a lot of time in Medicaid, one of the biggest drug pricing benchmarks out there is the 340B ceiling price. Within pharmacy, and U.S. drug pricing more generally, 340B is a big deal. For example, the value of the 340B program likely exceeded $35 billion in 2020.
Fortunately for us, we stumbled upon 340B prices and made a visualization for you to explore the price concessions within this important aspect of U.S. healthcare. The Texas Health and Human Services Department publishes via weekly updates their drug formulary file which contains the department’s best estimate of the current 340B ceiling price of the drug. To the degree that the Texas estimate was good enough for the federal Centers for Medicare and Medicaid Services (CMS) to approve their methodology for estimating 340B ceiling prices, our tool will reflect either the net price of the drug to Medicaid or a representation of the amount of money a 340B covered entity can make off the dispensing 340B acquired drugs.
Data Sources
Texas Medicaid Vendor Drug Program Formulary Drug File
How we Created our Dataset
46brooklyn's visualization tool of choice = Tableau Prep
Aggregate SDUD utilization and spending data for Medicaid programs in 2021
Join the Formulary Drug File information onto the aggregate SDUD information to calculate weighted average 340B prices for drugs in Medicaid by multiplying the current 340B price per unit to the average units per prescription in the Medicaid programs. We also prepare an estimate of the actual acquisition cost (AAC) of the medication according to Texas by using their AAC per unit in retail pharmacies multiplied by the same average units per prescription in the Medicaid programs.
Prepare an estimate of net Medicaid expenditures by comparing the weighted average Medicaid cost per prescription to the estimated 340B ceiling price per prescription
Prepare an estimate of net Medicaid expenditures by comparing the weighted average Medicaid cost per prescription to the estimated 340B ceiling price per prescription
How to Use
If you’re looking for some context and perspective on the tool and the underlying data, we recommend reading through the companion report to this visualization that we released in conjunction with dashboard in May 2022. NOTE: We strongly suggest reading this short report before using the tool to proactively answer basic questions on it use.
For other recommendations on practical usage of the dashboard:
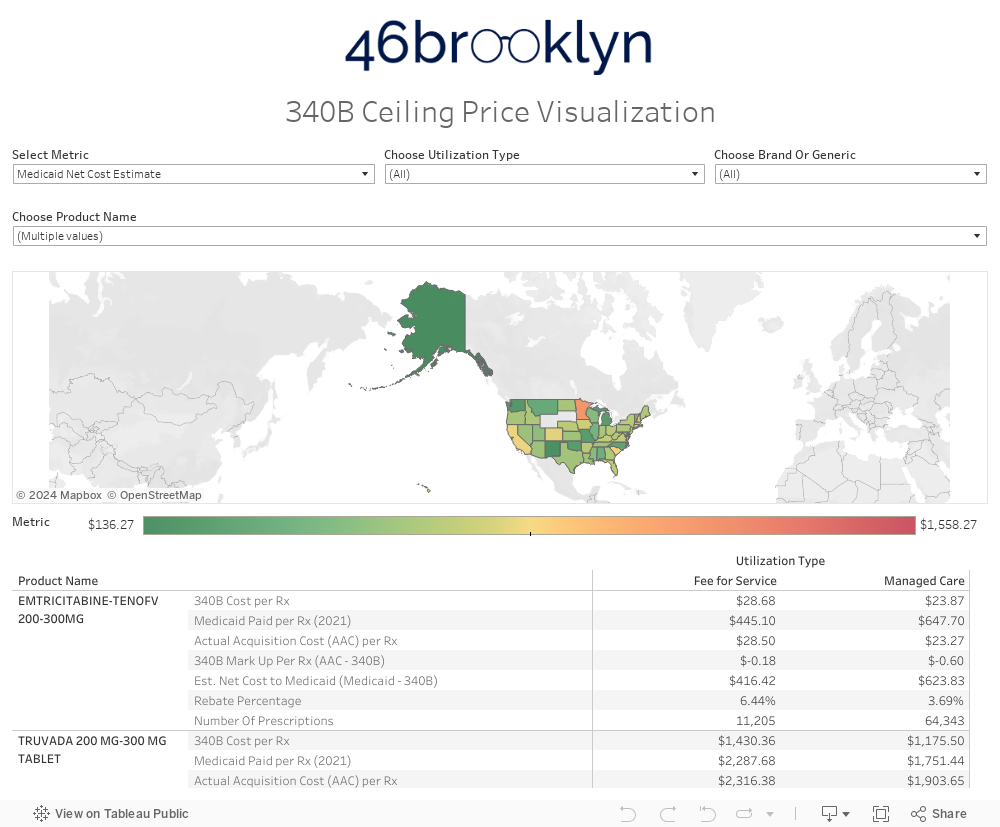
Select the “metric” to view on the map – either Medicaid Net Cost Estimate or 340B Mark Up to AAC
Choose the program type – Managed Care or Fee for Service (or don’t choose if you want to keep both)
Choose brand or generic (or don’t choose if you want options)
Choose a drug name or names from the list, or start typing one in (or don’t choose if you want to see aggregate program information)
Hover over any state to see the information for the drug(s) based upon your selected metric. You can click on the map above to either filter or exclude certain states from the analysis to refine your results.
Have questions on this viz? Contact us!
Update Frequency
TBD