
Abnormal Drug Price Increase Tracker (ADPIT)
Generic drug prices are designed to go down. This, we all know. But many generic drug prices go up as well. Most if the time, this is nothing to fret about – it’s just part of the random walk that is the price trend of all generic drugs. But other times, prices can increase quickly. It’s helpful to research these drugs to figure out what’s going on. But first we have to find them. If that’s what you’re looking to do, it’s time to call in some help from ADPIT – the 46brooklyn Abnormal Drug Price Increase Tracker!
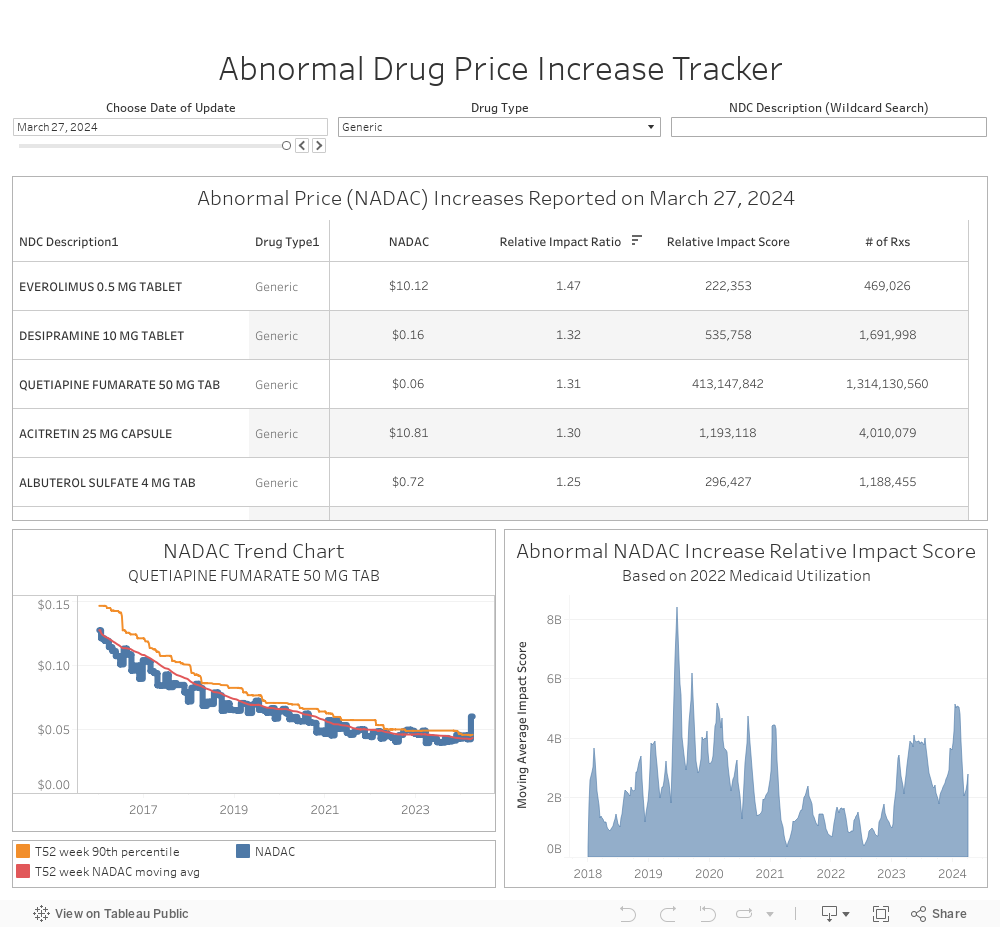
So how do we define “abnormal?” Well, that gets into an understanding of the natural historical volatility of each generic drug. So we added helpful statistics to CMS’ National Average Drug Acquisition Cost (NADAC) database, such as the trailing 52-week 90th percentile, and compared each week’s pricing to these stats. Each week, we flag all generic drugs that are “trading” at least 5% above their own trailing 52-week 90th percentile and present them to you.
Some price signals may be signs of a supply shortage. Some may simply be signs of a spike in demand. Some may be both! And then some may just be a normal correction in price to provide the incentive for more supply to come to market. The point is that this tool cannot show you shortages; it only flags “interesting” price spikes for further research. Please use it accordingly.
Data Sources
CMS National Average Drug Acquisition Cost Database
How we Created our Dataset
Please see the 3/19/2020 initiation report to this visualization for a discussion on how we built this database.
How to Use
Please see the 3/19/2020 initiation report to this visualization for instructions on how to use the tool.
Limitations to this Dashboard
Please refer to the FAQ page for this visualization
v 2.19 - updated August 7, 2024
For full release notes click here