
Peep Australia’s Sick Drug price discounts
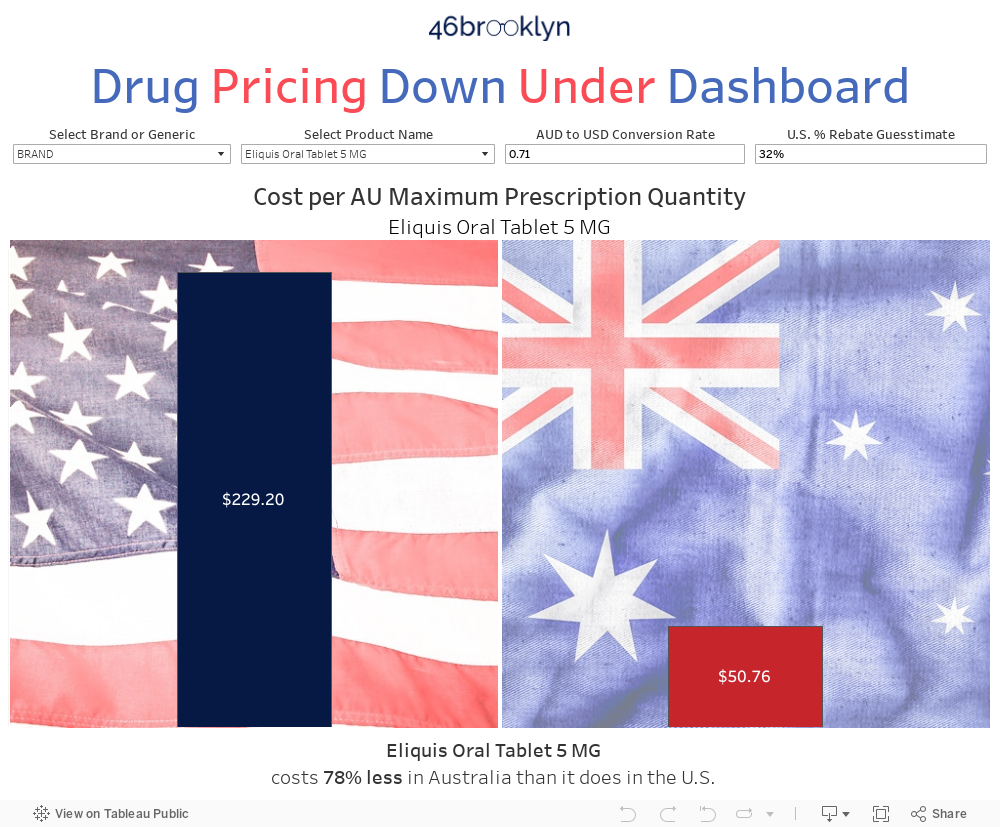
Currently, the idea of international reference pricing is “all the rage,” promoted across the aisle as a direct way to lower U.S. drug prices. When we decided to venture into this very deep Australian drug pricing rabbit hole, developing a tool to help quantify exactly how much cheaper drugs abroad really are was not our original intention. To be honest, we were just stoked that international prices – from any country – were available in a format that we could work with (thank you Australia!). Many frustrating months later (trust us, these databases don’t want to talk to each other … the project was far from a piece of piss), we were able to construct the visualization shown below, which allows you to navigate U.S. and Australia drug prices for 1,258 drugs (both brand and generic).
After you get past the disbelief in the discounts that somehow Australia is negotiating (it took us a while) grab a coldie and head on over to Expedia to book your next flight to Australia. The Canadian medical tourism industry is about to get a run for its money!
If you are interested in learning more about this visualization, reading our thoughts on what this tells us, or simply don’t believe these numbers and want a few examples of how you can gather them yourself, please make sure to read the companion research report to this visualization.
Data Sources and How we Created The Dataset
This was by far the most involved data project we have attempted to tackle. So much so that our methodology wasn’t going to fit neatly into a few bullet points here. Instead, we wrote a methodology document, which you can download here.
How to Use
Choose Brand or Generic drugs from the “Select Brand or Generic” drop-down
Select drug from the “Product Name” drop-down
Enter the latest AUD to USD conversion rate
Enter rebates on the drug … if you know them! We don’t, so we defaulted the parameter to 32%, the overall rebate Medicare Part D receives on branded drugs (make sure to zero this out when you are looking at generics)
Hover over the bars to see the prescription quantity (called Average AU Max Quantity) applied to both country’s unit prices
Update Frequency
Quarterly (at best)
NOTE: This visualization is best viewed on a laptop, desktop, or tablet. If you must view on a phone, at least flip it sideways please
v 1.0 - posted September 1, 2020
For full release notes click here