
Analyze Drug Market Share in Medicaid
If we want to understand drug pricing, we need to understand supply and demand. And any study of supply and demand inevitably is going to lead to the hunt for market share data. Market share is an easy and convenient place to start to try to make sense of all of the generic drug pricing ambiguity. Does a market share analysis show lots of competitors, each with with a relatively small slice of the pie? That’s a signal of healthy competition among generic manufacturers, which should result in lower prices long-term. Does a market share analysis show heavy concentration with one manufacturer? That’s not great for competition, and could explain pricing oddities for the drug.
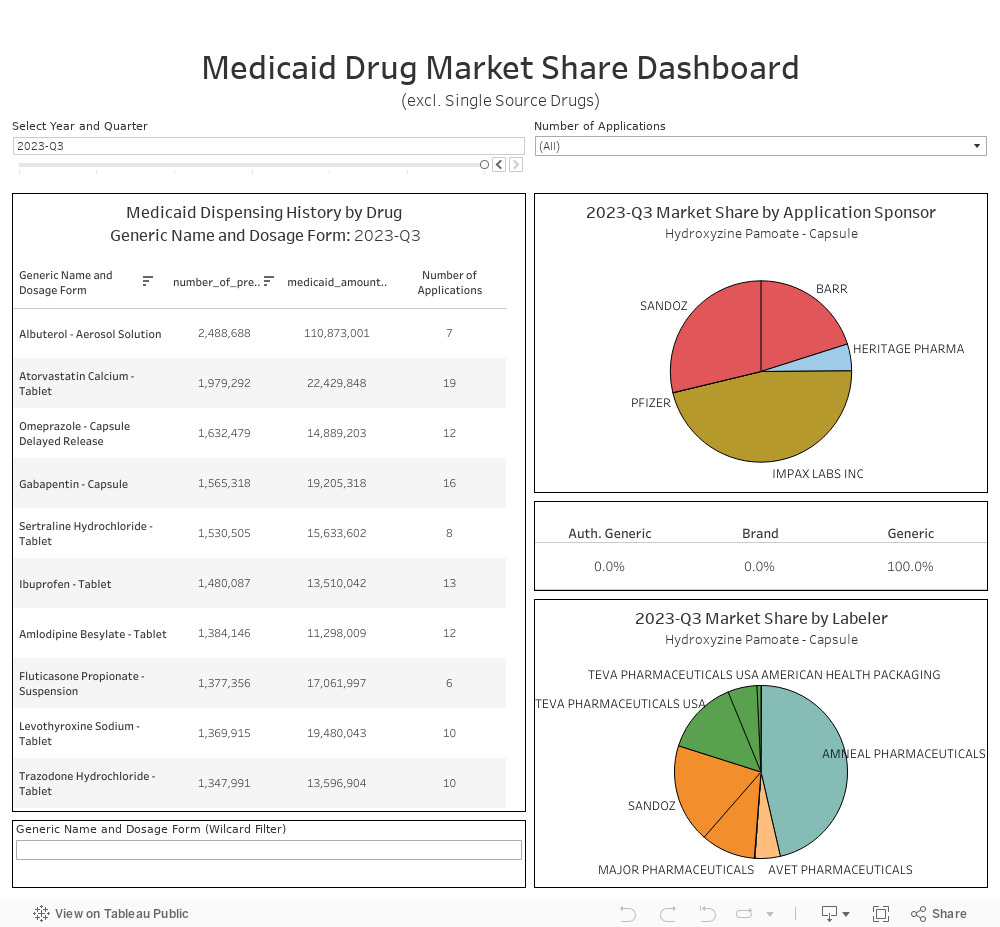
Our Medicaid Drug Market Share Dashboard can help answer these questions. We have joined public data from the FDA and CMS together with a backbone of drug classification data from Elsevier Gold Standard Drug Database to provide you with the ability to view Medicaid market share for any non-single source drug by drug applicant holder (i.e. sponsor) and labeler.
Data Sources
Drugs@FDA database (“applications” table)
How we Created our Dataset
46brooklyn's visualization tool of choice = Tableau Prep
Bring in Medicaid State Drug Utilization Data from Data.Medicaid.gov
Bring in FDA applicant name and application number from the “application” table available on Drugs@FDA
Join both databases in #2 and #3 to Elsevier Gold Standard Drug database, from which we grab all drug names and labelers
How to Use
Please see the companion report to this visualization for instructions on how to use the tool.
Limitations to this Dashboard
Please refer to the FAQ page for this visualization
v 1.01 - posted December 30, 2020
For full release notes click here