
Visualize “markup” on Medicaid generic drugs
In traditional PBM “spread” contracts with payers, the payer pays one price for a generic claim, and the provider is paid some other amount for that claim. While calculating the precise spread in Medicaid is not possible given that PBM payments to pharmacies are not public, we can get a feel for how disconnected the price paid is from the ingredient cost by comparing CMS’ state utilization data to CMS’ NADAC data. From this comparison, we have derived “markup” and have created a celestial-feeling visualization for you to see where all of it is and is not.
We recommend flipping through states, switching between managed care and fee for service, and studying the varying size of the bubbles (which represents the markup for each drug). Should our system really be designed to pay the supply chain wildly different margins for different drugs? What sort of incentives does this put in place for the supply chain? What sort of unintended consequences? For our thoughts on this matter, click here.
Data Sources
How we Created our Dataset
46brooklyn's visualization tool of choice = Tableau Prep
NADAC prices
Aggregate weekly NADAC into quarterly NADAC
Join State Utilization Database and lagged quarterly NADAC on NDC and Year-Quarter
How to Use
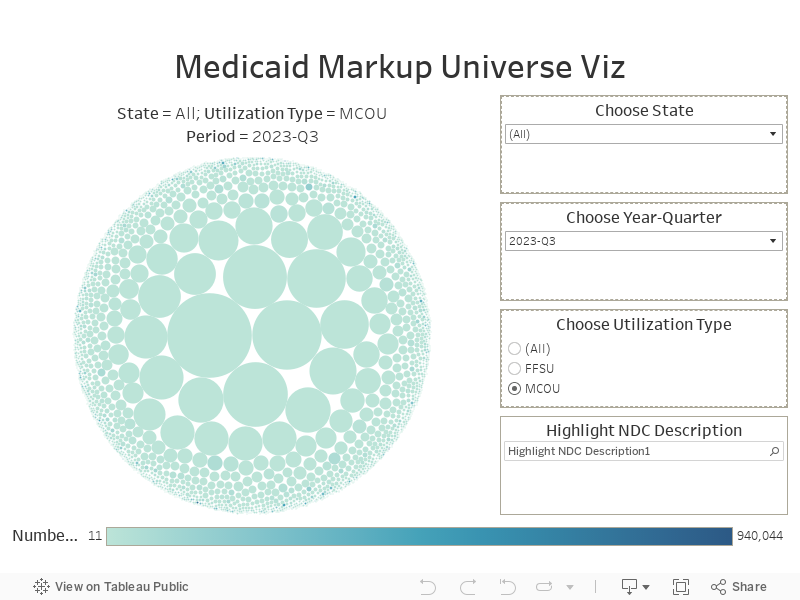
Each bubble is a different NDC Description (i.e. generic drug name)
The size of the bubble corresponds to the average markup per prescription
The color of the bubble corresponds to the number of prescriptions dispensed in Medicaid within the chosen time period
The viz defaults to "All" states, but you can choose individual states as well
Choose fee for service or managed care
Choose one or multiple quarters
Hover over any bubble to bring up a “tooltip” with the drug name, prescription count, markup, and other pertinent information
If you are looking for a specific drug start typing the name of the drug into the “Highlight NDC Description” field. The viz will immediately start to filter as you type. You can then select a drug from the list and Tableau will highlight the bubble for you.
v 1.8 - posted August 2, 2024
For full release notes click here