
How much was that latest NADAC survey update worth?
Each week CMS posts updates to its National Average Drug Acquisition Price (NADAC) database. It quietly happens each Tuesday, without much fanfare. If you check this weekly, you likely have noticed that most weeks, not much changes. Maybe there were a few calls into the CMS help desk that triggered a price update, or a random wholesale acquisition cost (WAC) update on a brand name drug. But there is one week each month (normally either the 3rd or 4th week) where there is a lot of pricing action, almost exclusively within generic drugs. We call this “survey results week,” the week when CMS publishes changes to thousands of NDCs based on the survey results from prior month invoice costs reported by pharmacies all across the country.
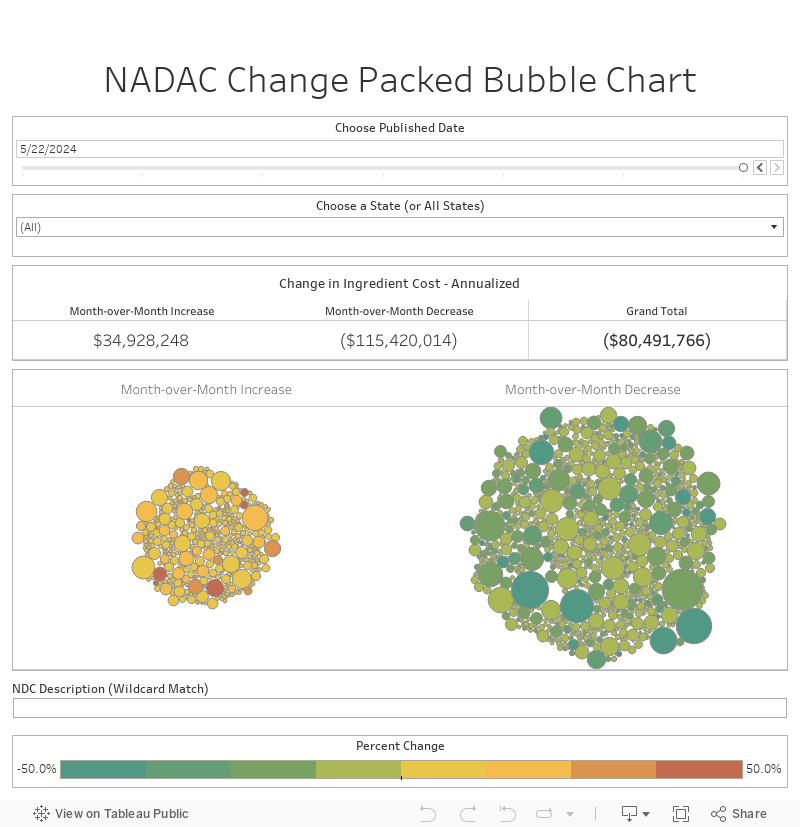
When you dig into the changes you'll find thousands of generic prices went up or down. It left us wondering, what's the aggregate impact of all of these changes? That question led to this visualization, which aims to assess the aggregate impact of all of the generic drug price changes using Medicaid's overall drug mix. Hopefully this adds some much needed context to this critical monthly update.
Data Sources
Most recent CMS NADAC Comparison Database
How we Created our Dataset
46brooklyn's visualization tool of choice = Tableu Prep
Join 2023 State Utilization Database and NADAC Comparison Database on NDC (annualized)
Filter database down to tablets and capsules only (to avoid unit misatches)
Multiply absolute change in NADAC by Medicaid units dispensed to get impact.
How to Use
Each bubble is a different NDC Description (i.e. generic drug name)
The color of the bubble corresponds to the % change in the most recent survey
The size of the bubble corresponds to the annualized Medicaid impact
The viz defaults to "All" states, but you can choose individual states as well
v 5.0 - data as of 6/18/2025
For full release notes click here