
May your holidays be filled with generic drug deflation!
One last present to unwrap
Last month, we reported on the $80 million generic drug deflation manufacturers were delivering to the U.S. healthcare system (based on Medicaid drug utilization), which at the time were served up alongside the Thanksgiving holiday. Well it seems that the holiday spirit has not been lost on our these manufacturers as they stepped up and delivered another $65 million in generic drug deflation to close out the year.
In the spirit of giving, we will gift our readers with what is hopefully one of our shortest NADAC generic drug pricing updates ever. But we encourage you to rest up, because this isn’t the last present we at 46brooklyn intended to deliver this holiday season. We have been working hard over the last few months and have something special planned to ring in the New Year and start 2021 off on the right foot. Get the champagne on ice, because we have a real treat in store. Stay tuned, but for now, here’s your monthly dose of generic drug price changes…
What happened?
On December 23rd, CMS published its latest update to the National Average Drug Acquisition Cost (NADAC) database. This was an early present to those of us at 46brooklyn so we set aside our egg nog (temporarily, of course) and immediately set to work crunching the numbers. As a reminder, NADAC is the best national public database of surveyed pharmacy invoice costs to acquire prescription drugs. In other words, if you are looking to understand what pharmacies are paying to purchase drugs from their wholesalers each month (before rebates), and you spent too much money on holiday gifts to pay for the data, NADAC is where you must go.
As we’ve discussed at length, NADAC is lagged by roughly two months. So the survey prices we just received this December reflect pharmacy invoice costs from October.
As already mentioned, today’s key takeaway is our finding that this month’s NADAC price changes equated to $65 million in annualized generic drug deflation based on Medicaid’s drug utilization. That’s right, generic drug manufacturers are certainly full of holiday cheer this year, something we could all likely use a little more of this of all years, and kept the giving going from November into December.
If you’re interested in unwrapping a few more gifts, read on…
1. Unweighted price change analysis is a mixed bag
Each month, we first look at how many generic drugs went up and down in the latest month’s survey of retail pharmacy acquisition costs, and compare that to the prior month (Figure 1).
Basically, the quick way to read Figure 1 is to look for blue bars that are taller than orange bars to the left of the dotted line, and exactly the opposite to the right of the dotted line. That would indicate a good month – more generic drugs going down in price compared to the prior month, and less drug prices going up.
Figure 1
Source: Data.Medicaid.gov, 46brooklyn Research
When we look at prices through this lens, December would not appear to be an overly good month for generic drug deflation. When we look at drugs that moved one way or another by single-digit percentages, there were 12% fewer drugs that decreased in price by 0-10% and 3% more drugs that increased by 0-10% in December compared to November. The blue and orange bars do not appear to be behaving like we’d like for a “good month.”
Turning to the drugs that moved by double-digit percentages, 14% more drugs decreased by more than 10%; however, these were offset by 23% more drugs that increased by more than 10%. Of course, as our loyal readers will know, simply knowing the direction of the numerical counts in drug price changes is not overly helpful, and we need to keep unwrapping this story.
2. Weighted Medicaid generic deflation holds steady at $65 million
To better answer the drug pricing question, we need to apply utilization (drug mix) to the price changes, which is the purpose of the NADAC Change Packed Bubble Chart (Figure 2). We use Medicaid’s 2019 drug mix from CMS to arrive at an estimate of the total dollar impact of the latest NADAC pricing update. This helps quantify the real impact of those price changes from a payer’s perspective (in our case Medicaid; individual results may vary).
The green bubbles on the right of the Bubble Chart viz (screenshot below in Figure 2) are the generic drugs that experienced a price decline (i.e. got cheaper) in the latest survey, while the yellow/orange/red bubbles on the left are those drugs that experienced a price increase. The size of each bubble represents the dollar impact of the drug on state Medicaid programs, based on utilization of the drugs in the most recent trailing 12-month period (i.e. bigger bubbles represent more spending). Stated differently, we simply multiply the latest survey price changes by aggregate drug utilization in Medicaid over the past year, add up all the bubbles, and get the total inflation/deflation impact of the survey changes.

Figure 2
Source: Data.Medicaid.gov, 46brooklyn Research
Overall, in December, there was $97 million worth of inflationary drugs, offset by $162 million of deflationary generic drugs, netting out to a very robust $65 million of deflation for Medicaid. A pretty solid month in terms of generic deflation, and certainly a welcome present for us drug pricing research nerds.
But before we dive into some of the specific drug details, we have one more top level analysis to run – that is to investigate how generic drug prices are trending over time.
3. Year-over-year generic oral solid deflation holds at 15%
Ever since last June, we have been tracking year-over-year generic deflation for all generic drugs that have a NADAC price. We once again weight all price changes using Medicaid’s drug utilization data. Beginning in August 2019, we had been seeing a gradual compression in deflation (Figure 3). But oddly enough, as the pandemic started, this trend started to reverse, only starting to return over the last few months. This month, oral solid generic deflation held at 15% year-over-year (YoY), solidly above its average over the past 24-months and holding steady from last month. Deflation on all generics decreased slightly to 11%.
Figure 3
Source: Data.Medicaid.gov, 46brooklyn Research
4. Stocking up on generic drug deflationary essentials
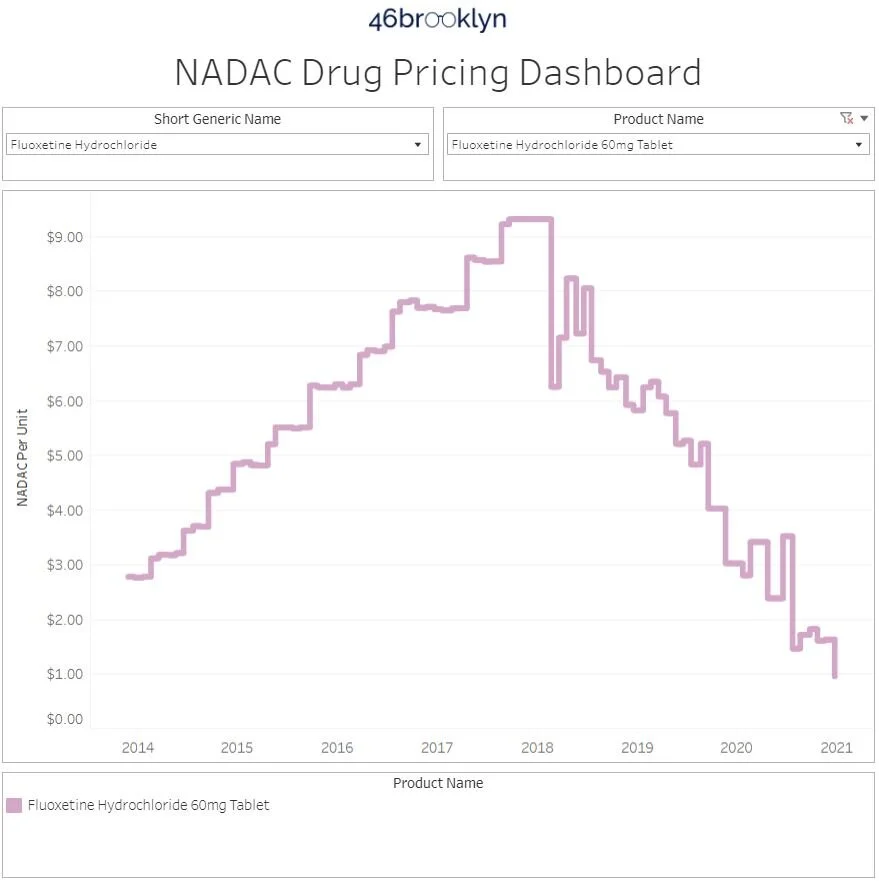
We decided to keep the holiday tradition going here at 46brooklyn and rather than have to introduce you to each drug deflation story individually via lengthy text, we will skip all that and instead just show you. To that end, we made a gallery of all their pricing trends (Figure 4 below) for you to flip through and see for yourself. Hopefully the half-dozen we’ve selected give you a sense for just how widespread the generic deflation cheer is this time of year.


5. ADPIT highlights upward price movements on some popular (but still very cheap) generics
Finally, let’s check in on our Abnormal Drug Pricing Increase Tracker (ADPIT) and see what it has to say about this month’s data. As a reminder, ADPIT takes all of the NADAC prices for one drug over any given 52-week period, ranks them, finds the 90th percentile for the price, and then compares the current price to that 90th percentile price. If the current price is above the 90th percentile, we consider the current week’s price to be “abnormal” and add it to the list for you to peruse. Then we do this for another 20,000 or so drugs for good measure to complete the list, shown in Figure 5.
If this is the first time you are seeing this, we include the number of annual Medicaid prescriptions for each of these abnormally priced drugs, and then two metrics we created – one called Relative Impact Ratio (RIR) and another called Relative Impact Score (RIS). RIR simply tells you how far above the 90th percentile a drug’s price currently is (i.e. Montelukast at 1.29 means its 29% above its T-52 week 90th percentile price). RIS multiplies the number of annual Medicaid prescriptions by (RIR - 1) to size the impact of the “pricing abnormality” (for montelukast, 29% x 4,884,563 prescriptions = 1,401,401). Add up all the RIS for all of the drugs each week, take the four-week moving average, and you get the chart in bottom right of Figure 5 (which sizes the aggregate weighted impact each week). We then divide the bottom right chart into drugs with active ingredients in ongoing COVID-19 clinical trials, and all other drugs. Check out our interactive ADPIT tool here, and find more information on how to use it here and here.
Figure 5
Source: Data.Medicaid.gov, ClinicalTrials.gov, 46brooklyn Research
Overall, the dashboard continues to paint a very healthy picture for the generic marketplace, although aggregate RIS (i.e. the lower right box) continues to trend up. Whereas last month, six out of the top 10 drugs ranked by RIS sold over one million prescriptions in Medicaid in 2019, this month all 10 sold over one million. But each of these drugs are relatively low cost compared to the rest of the U.S. drug pricing marketplace.
6. Looking ahead to 2021
We have spent a lot of time looking at generic drug prices over the last two years, and this year we have seen a very impressive and resilient generic drug marketplace. Despite an unprecedented global pandemic, generic drugs delivered an almost $500 million in annual generic deflation to Medicaid compared to this time a year ago. And while this number is not quite as impressive as the 800 million packages the U.S. Postal Service will deliver between Thanksgiving and New Year’s Day, it is certainly worth taking a brief moment to pause and admire.
However, one thing we’ve consistently encountered in our work over the last two years is the public’s predominant focus on brand name medications. Whether it is well-known brand name products like insulins Lantus or Levemir, or the specialty medications like Copaxone, most of the people in our “drug pricing family” are focused on brand name drugs as a key driver of costs in the U.S. healthcare system. The truth is that although generics are 90% of the drugs dispensed in the U.S., brands account for 70%+ of spending for most payers.
To that end, if your New Year’s wish was for 46brooklyn to begin monitoring and talking about brand name prices more (of course, we can’t blame you if this is your second wish after the end to the pandemic), well you are in luck as we plan to launch a new dashboard to better monitor brand name prices starting January 1, 2021. So don’t party too hard New Year’s Eve as we’re certain this isn’t something you’ll want to miss.
Thanks to all of our 46brooklyn supporters for another great year of dorky drug pricing reports and even dorkier pop culture references. We hope to bring you bigger and better insights in the coming year. We hope you will consider supporting our efforts. Enjoy the rest of your holiday week, and have a happy New Year.