
What’s happening to generic drug prices? May 2019 NADAC Survey Update
Last week was NADAC survey results week, which means it’s time to check in on generic drug price changes.
There was a lot of movement on drug prices this month, so be sure to click through our new updated visualizations (NADAC Change Packed Bubble Chart and Drug Pricing Dashboard) to see the impact.
As a reminder, each month retail pharmacies across the country are surveyed by Myers Stauffer (on behalf of the Centers for Medicare and Medicaid Services) on their wholesaler invoice prices. The results are then compiled and released either the third or fourth week of the following month. On May 22nd, survey results were released that reflect National Average Drug Acquisition Cost (NADAC) price changes from April. Here are our top takeaways on the results:
1. An ugly month for generic prices
Each month, we first look at how many generic drugs went up and down in the latest month’s survey of retail pharmacy acquisition costs, and compare that to the prior month. As shown in Figure 1, May was not a good month for generic prices. As shown below, there were a lot more drugs that increased in price this month when compared to last month, and a lot less drugs that decreased in price.
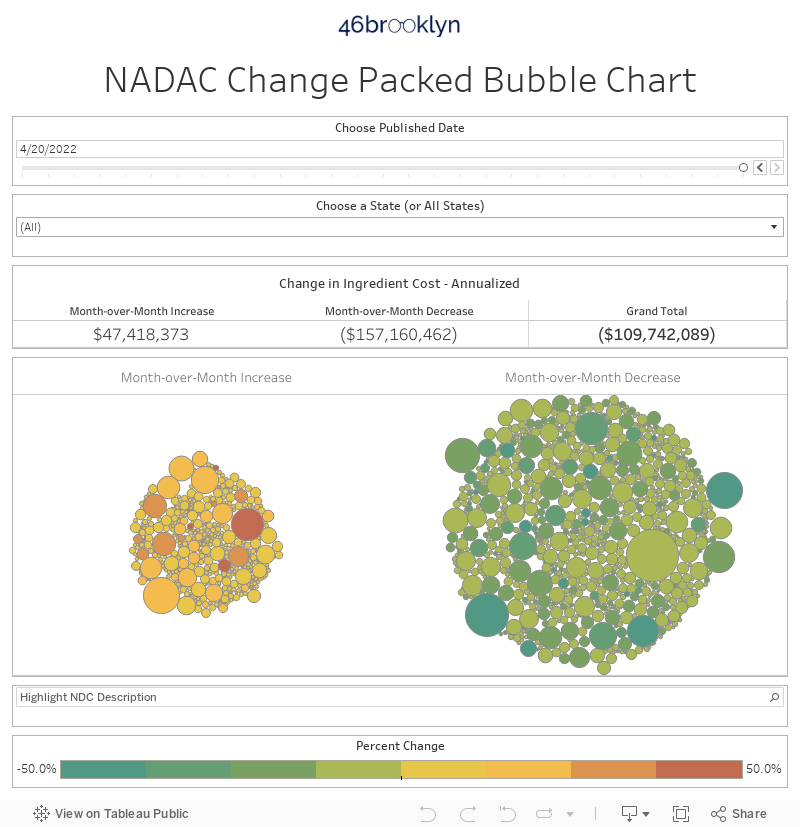
Figure 1
Source: Data.Medicaid.gov, 46brooklyn Research
To put some numbers to this, for every generic drug that experienced a price decline this month, there were a staggering 1.79 generic drugs that experienced a price increase. That’s way up from a ratio of 0.62 last month.
Also, in May, there were 31% more generic drugs that experienced a 0-10% price increase, and 235% more generic drugs that experienced a price increase of more than 10%. Conversely, there were 35% fewer drugs that experienced a 0-10% price decrease, and 53% fewer drugs that experienced a price decrease of more than 10%.
2. This month brought $86 million of annualized inflation using Medicaid’s drug mix
As we’ve written in prior updates, knowing the price change alone is not enough. We need to apply utilization (drug mix) to the price changes, which is the purpose of the NADAC Change Packed Bubble Chart. We use Medicaid’s 2018 drug mix to arrive at an estimate of the total dollar impact of the latest NADAC pricing update. The green bubbles on the right of the dashboard below are the generic drugs that experienced a price decline in the latest survey, while the yellow/orange/red bubbles on the left are those drugs that experienced a price increase. The size of each bubble represents the annualized weighted impact of the drug on Medicaid – i.e. we multiply the survey price change by aggregate drug utilization in Medicaid. Add up all the bubbles and we get the total annualized inflation or deflation. This month, there was $86 million of inflation.
3. A longer-term perspective on Medicaid deflation
Before we get out our pitchforks and torches, let’s see how much deflation generic manufacturers have delivered over a longer period of time by roughly comparing year-over-year rates of inflation/deflation. There’s no perfect way to do this, but this exercise should give you a ballpark idea of how well things are going lately relative to prior years. So we’ll just pick one way to do the comparison, explain how we did the work, and give you the workbook.
Objective
Compare May 2019 TTM (trailing 12-month) inflation/deflation to May TTM inflation/deflation in 2015-2018.
Methodology
For each May TTM period:
Calculate price change by National Drug Code (NDC) from the end of the prior May (“n-1”) to the end of the current May (“n”). Note: we are analyzing oral solids only to avoid units of measure mismatches. For an explainer on why that’s necessary, see discussion here.
Multiply NDC price change by utilization, using prior year drug utilization (e.g. May 2019 TTM pricing analysis uses 2018 Medicaid drug utilization, May 2018 TTM pricing analysis uses 2017 Medicaid drug utilization) to arrive at the total weighted pricing change for the period.
Divide total weighted price change by the total cost calculated using n-1 pricing to arrive at inflation/deflation over the period.
Results
The chart below shows the results of this analysis. After accelerating to 17% deflation in 2017, it does appear that deflation is moderating. However, May 2019 TTM deflation remains in double-digits, which is still much better than where things were at in 2015. Nonetheless, this decreased rate of generic drug deflation is meaningful and something to keep an eye on, especially in light of some of the recent revelations of alleged price fixing going on in the generic drug industry.
We’ll start tracking this annual comparison analysis every month going forward in these updates.
Figure 2
Source: Data.Medicaid.gov, 46brooklyn Research
4. Many drugs keep bouncing up and down
Many of the drugs that experienced some of the biggest increases and decreases in price are drugs that have shown a history of fluctuation. As you can see in the NADAC Change Packed Bubble Chart, a lot of the pricing impact came from drugs like generic Concerta (Methylphenidate ER) and Adderall XR (Dextroamphetamine-amphetamine ER). We highlighted these Methylphenidate issues in our January 2019 NADAC report. Keep in mind in this report and others, we may not always address the biggest bubbles, because they represent drugs that experience frequent yet slight movements month to month.
5. The prices of generic Carbatrol/Tegretol (Carbamazepine ER) have been sneakily rising
Our monthly NADAC survey updates typically track the monthly changes to the CMS NADAC price list, as determined by monthly survey results of pharmacy invoice costs. However, in between those monthly survey updates, CMS conducts weekly tweaks based on the following:
On a weekly basis, the NADACs for generic drugs are reviewed and adjusted as necessary based on research initiated by pharmacy inquiries into the NADAC Help Desk. If research, such as evaluating marketplace availability and contacting other pharmacies, substantiates that a change in price for a generic drug has occurred, a revised NADAC is calculated and included in the next weekly NADAC reference file update … Provider inquiries regarding the NADAC will be investigated and evaluated based upon invoice data collected from the pharmacy initiating the review, additional pharmacies contacted by the help desk, and other market factors, such as compendia price changes. NADACs will be adjusted when drug pricing changes have been substantiated and those adjustments will be reflected in the NADAC rate updates published on a weekly basis. In addition, new drugs as identified by CMS that meet the NADAC criteria are added.
This means that at times, a drug price increase or decrease is being caught or occurring in between our monthly reports and won’t always be reflected in those reports. Essentially, NADAC is working more thoroughly than us.
This is why our Drug Pricing (NADAC) Dashboard is such an important tool. While we only update it monthly, it shows every week’s worth of changes. It catches all those pesky price updates that may not be reflected in our monthly NADAC Change Packed Bubble Chart.
Here’s an example of what we’re talking about.
Take generic Carbatrol/Tegretol (Carbamazepine ER), an anticonvulsant used to treat seizures, nerve pain, and bipolar disorder. While there are six different dosage forms/strengths of Carbamazepine ER, as shown in Figure 3, only three of those strengths appear in our NADAC Change Packed Bubble Chart – just the tablets. This means that new NADAC survey update saw no changes in other three versions of Carbamazepine ER – all of the capsules.
Figure 3
Source: Data.Medicaid.gov, 46brooklyn Research
Those three tablet versions of Carbamazepine ER rose by 7.6% (100 mg), 5.8% (200 mg), and 12.2% (400 mg). But what about those capsule versions?
If you take a look at Carbamazepine ER on our Drug Pricing (NADAC) Dashboard, you’ll see that those capsules did have some very significant pricing movement within the last month; it just happened in the middle of the month rather than during a survey update. We’ve highlighted both the tablets and capsules below in Figure 4.
Figure 4
Source: Data.Medicaid.gov, FDA.gov (NDC lookup), 46brooklyn Research
As you can see above, those three capsule versions had jumps of their own: 127% (100 mg), 103% (200 mg), and 74% (300 mg).
Figure 5 looks at this from a slightly different angle – total year-to-date price change by dosage form/strength.

Figure 5
Source: Data.Medicaid.gov, 46brooklyn Research
As you can see, it’s apparently good to be a capsule! What’s fascinating to us though is that it’s not the capsule, but the tablet that is explicitly called out in the recently-announced 44-state lawsuit alleging past price-fixing among generic drug companies.
Maybe a rising tide (eventually) lifts all boats?
6. Prices of generic Voltaren XR (Diclofenac Sodium ER) have exploded over the last year
Part of the benefit of our new year-to-year analysis above in section 3 is that we get to take a more elongated view of pricing trends of drugs over time. As we noted with Methylphenidate and Dextroamphetamine-amphetamine, some drugs show some erratic pricing behavior month-to-month, so tracking an overall price decline/incline over a year provides a more complete picture and elongated trend.
When we examine which drugs increased in price from May 2018 to May 2019, generic Voltaren XR (Diclofenac Sodium ER 100 mg Tab) showed one of the steepest rates of increase at 470% for the 12-month period.
We estimate that Medicaid collectively paid for just over 2.5 million tablets of Diclofenac Sodium ER 100 mg in 2018. As such, we calculate that the 470% increase ($0.29 to $1.66) represented an annualized cost to Medicaid of just under $3.5 million. Mind you, this ingredient is available in a delayed release tablet at 25 mg, 50 mg, and 75 mg strengths. We’ve shown the price history of all three in Figure 6, in addition to the ER 100 mg version. The cheapest one (75 mg) is $0.12 per tablet, compared to $1.66 per tablet for the ER 100 mg. Hopefully these delayed-release tablets don’t follow the path of the Carbamazepine ER capsules…
Figure 6
Source: Data.Medicaid.gov, FDA.gov (NDC lookup), 46brooklyn Research
To be clear, delayed release and extended release tablets are not interchangeable at the pharmacy counter. But as we have been pointing out repeatedly lately, someone (cough, PBM) needs to take responsibility for assessing the cost/benefit of drugs that are arguably therapeutically equivalent to better protect payers from situations like this one, especially when there are such wild swings in the “cost” part of that equation.
Part of the reason we are just catching this now is that just like Carbamazepine, its biggest price jumps occurred via weekly NADAC “help desk” adjustments that weren’t related to pharmacy survey results.
Thanks to our new year-over-year analysis, we’ve been able to catch this stealthy whopper of an increase.
Now let’s root around in the data and try to figure out what caused it.
Let’s start with the timing of the price spike – June 2018. It turns out that this was just two months after Mylan Pharmaceuticals discontinued production of its version … and one month after Lannett brought its version of the drug to market.
A quick diversion on how we figured out the Lannett piece of the puzzle, as it was more difficult than we expected it would be. Here’s why.
The FDA lists Lannett’s marketing start date for this drug as 11/6/2002. It turns out that this is the exact same start date the FDA lists for the Actavis (owned by Teva) NDC. Dig a bit deeper and you’ll find that both Actavis/Teva and Lannett are marketing off of the same ANDA (ANDA 07621), which is owned by Dexcel Pharma. And can you guess the approval date of the application? 11/6/2002 (and then there is the crazy coincidence that Dexcel Pharma happens to be the manufacturer of Omeprazole 20 mg Tablets that were subject to wild overcharges in Ohio Medicaid managed care. You can’t make this stuff up).
This is an unfortunate bit of education we just stumbled upon. The marketing start date in the FDA’s database appears to not be the start date for the NDC, but for the ANDA? Hopefully this was just an error for this one drug and is not generally true, because it clearly would further muddy the waters when it comes to analysis of the drivers of drug price inflation. Please contact us if you have any more information on this.
So how do we find the true marketing start date for an NDC when multiple NDCs are being marketed off the same application? You take advantage of the fact that a labeler also sets a list price for the drug (e.g. AWP, SWP, WAC) and the date when its set is reported to all of the pricing compendia. So we just needed to find the date when Lannett first set the AWP/SWP for their NDC and that would give us a good idea for when the drug was brought to market. A few calls and we had the answer – May 2018 – one month before the price of the drug took off.
Fast forward to today and Actavis/Teva’s NDC is now inactive as well (end marketing date of 10/31/2019). That leaves us with Lannett, Oceanside (owned by Bausch Health – formerly known as Valeant Pharmaceuticals), and Sandoz. However, according to our market share dashboard (which only includes currently active NDCs for now), Sandoz didn’t have any Medicaid market share in Q4 2018.

Figure 7
Source: Data.Medicaid.gov, FDA.gov (orange book), FDA.gov (NDC lookup), 46brooklyn Research
So that leaves us with Lannett and Oceanside. We called a pharmacy friend who buys through one of the top the drug wholesalers, and they confirmed that, indeed, they could only purchase Lannett and Oceanside versions of this drug.
Clearly there is a lot of noise around Teva, Mylan, and Lannett – these three manufacturers are the central characters in the recent generic drug price-fixing lawsuit, and all three were at one time involved with this drug. To add to the intrigue, Diclofenac is littered all throughout the suit. But all of this evidence could be circumstantial. Frankly, while focusing on the collusion story is sexy, it risks distracting our focus from the key learning, which in our view, is that it’s silly to expect a well-functioning generic market for a drug when there are only two competitors (whether they are colluding or not).
What are you seeing?
While we spend more time than we’d like to admit studying the pricing changes during each NADAC Survey Results Week, we don’t always catch every story worth noting. Be sure to take a gander at all of our updated Visualizations that rely on NADAC prices. If you’re seeing any interesting movement on drugs in the dataset, let us know.
This month, 46brooklyn co-founder Antonio Ciaccia joined Scott Kjelson on the PoliTalkRx podcast to discuss pharmacy issues in Ohio and the work of 46brooklyn. Give it a listen.