
What’s happening to generic drug prices? August 2019 NADAC Survey Update
Hi there again, drug pricing aficionados. Good news. CMS recently released their latest NADAC survey results, which means it’s time to check in on this month’s generic drug price changes.
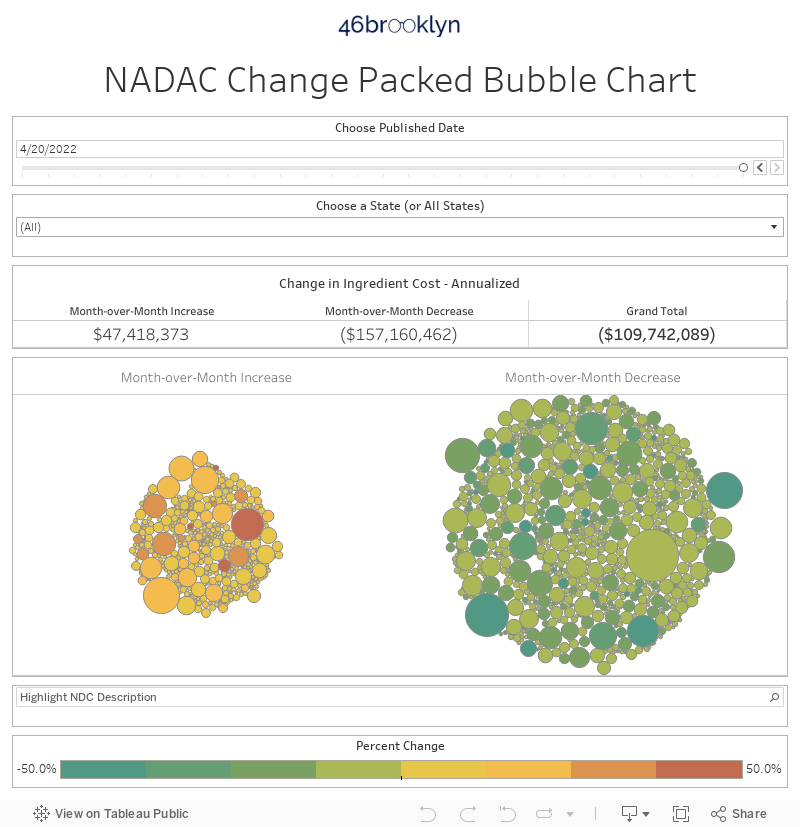
There was a lot of movement on drug prices last month, so be sure to click through our new updated visualizations (NADAC Change Packed Bubble Chart and Drug Pricing Dashboard) to see the impact.
As a reminder, each month, retail community pharmacies across the country are surveyed by Myers Stauffer (on behalf of the Centers for Medicare and Medicaid Services) on their wholesaler invoice prices. The results are then compiled and released either the third or fourth week of the following month. On August 21st, survey results were released that reflect National Average Drug Acquisition Cost (NADAC) price changes from July. Here are our top takeaways on the results:
1. Ahhhh … That’s more like it!
Each month, we first look at how many generic drugs went up and down in the latest month’s survey of retail pharmacy acquisition costs, and compare that to the prior month. As shown in Figure 1, there were a lot fewer drugs that increased in price this month when compared to last month, and a lot more drugs that decreased in price.
Figure 1
Source: Data.Medicaid.gov, 46brooklyn Research
To put some numbers to this, for every generic drug that experienced a price decline this month, there were only 0.79 generic drugs that experienced a price increase. That’s way down from a ratio of 1.07 last month.
Also, in August, there were 13% more generic drugs that experienced a 0-10% price decrease, and 24% more generic drugs that experienced a price decrease of more than 10%. Conversely, there were 14% fewer drugs that experienced a 0-10% price increase, and 20% fewer drugs that experienced a price increase of more than 10%.
2. Generic prices are going down for real again
As we’ve written in prior updates, knowing the price change alone is not enough. We need to apply utilization (drug mix) to the price changes, which is the purpose of the NADAC Change Packed Bubble Chart. We use Medicaid’s 2018 drug mix to arrive at an estimate of the total dollar impact of the latest NADAC pricing update. The green bubbles on the right are the generic drugs that experienced a price decline in the latest survey, while the yellow/orange/red bubbles on the left are those drugs that experienced a price increase. The size of each bubble represents the annualized weighted impact of the drug on Medicaid – i.e. we multiply the survey price change by aggregate drug utilization in Medicaid. Add up all the bubbles and we get the total annualized inflation/deflation. This month, it was an impressive $105 million in annualized deflation.
3. Year-over-year deflation increases to 15%
If you read takeaway #1 and #2, then takeaway #3 shouldn’t come as much of a surprise. Trailing-twelve-month generic deflation stepped up a solid two points to 15% this month, right in line with average deflation over the past 24-months.
So now it seems that the June Gloom has cleared and the generic marketplace is back to mid-double-digit deflation (to the chagrin of a group of bloodied generic manufacturers). The few payers out there that actually pay generic prices linked to a pricing benchmark based on market-reflective rates like NADAC (i.e. pharmacy invoice acquisition costs) can now rejoice, while the rest of the payers can stare at stale, unchanging generic claim prices in August and wonder where all of these deflationary savings have wandered off to.
Seriously though, if you really are not aware of where this money is going then read this, and then this, and then this, and then this.
Figure 2
Source: Data.Medicaid.gov, 46brooklyn Research
If you’re curious about how we created this chart, take a look at our June 2019 NADAC survey report for more detail on our methodology.
4. Generic Viramune XR prices take another sizable drop
As we have highlighted in previous reports, the costs associated with HIV/AIDS drug therapy can be very cost-prohibitive. However, there are some commonly-used medications that have gone generic and are declining in price. Generic Viramune XR (Nevirapine ER 400 mg Tablet) prices have been slowly eroding over the last few years, but this past month saw a strong 45% decline, moving from $5.91 per tablet to $3.27 per tablet (Figure 3).
Figure 3
Source: Data.Medicaid.gov, 46brooklyn Research
5. Generic Vfend has hit its lowest price ever, but you may not have known that
In October 2009, Pfizer announced a settlement and license agreement to prolong Mylan’s sought-after generic launch of Pfizer’s Vfend (Voriconazole) until early 2011. While Vfend was a smaller product offering from Pfizer, it was a very expensive medication, giving generic manufacturers like Mylan an excellent opportunity to turn good margin while simultaneously driving cost savings to patients and payers.
Mylan officially brought Voriconazole to the market in February 2011, putting the wheels in motion to start yielding savings through competition. Those savings were being desperately sought globally, as was on display in this 2015 Bloomberg feature on drug affordability in China.
As you can see below in Figure 4, the NADAC (since November 2013, when NADAC reporting began) of generic Vfend (Voriconazole) has slowly but surely been trickling its way downward over the last five years.
Figure 4
Source: Data.Medicaid.gov, 46brooklyn Research
Specifically, the price for Voriconazole 200 mg was as high as $27.58 per tablet in January 2014. This past month saw one another big drop, bringing the NADAC to its lowest point ever at $3.97 per tablet.
While this rate of deflation is nowhere near what we saw recently with generic Viagra (Sildenafil), this is a tremendous amount of price erosion nonetheless. If a patient were taking 60 tablets per prescription on average, this would amount to a savings of more than $1,400 per month.
Word of warning though: As we have discussed with other medications that see significant deflation over time, Voriconazole is another drug that appears to be caught up in the drug supply chain’s markup madness, meaning that all this deflation may not necessarily mean good news for the patients and payers who foot the bill.
Here’s what state Medicaid managed care programs are getting charged by their health plans and PBMs for a drug whose cost declined by more than 85% over the last five and half years:
Figure 5
Source: Data.Medicaid.gov, 46brooklyn Research
And it doesn’t get much better in the Medicare Part D world either. If you check out our Medicare Part D Drug Pricing Ski Slope, you’ll see what costs Part D plans and their PBMs are reporting back to CMS for a drug that as of Q1 2019 had a NADAC of $4.76 per tablet. Around 20% of all the plans are still paying at or above the 2014 rate, and the average cost among all Part D plans is $16.42 per tablet – more than triple the cost of the actual drug (Figure 6).
Figure 6
Source: CMS.gov, Data.Medicaid.gov, 46brooklyn Research
Another example of how sometimes, the market works, but the complicated nature of the drug supply chain may be keeping the benefits for itself.
6. Generic Verelan PM prices continue to rise amid monopoly
In May, we highlighted how generic Verelan PM (Verapamil ER PM) prices essentially exploded overnight. We learned that shortly after Mylan pulled their generic version from the market, leaving the other lone manufacturer Kremers Urban Pharmaceuticals to do as they pleased in their newfound monopoly. (Spoiler alert for those who didn’t read our May report: they jacked up the price)
August’s NADAC survey update shows two strengths of Verapamil ER PM staying put, but the 300 mg strength jumping yet again – this time from $5.82 per capsule to $6.73 per capsule (Figure 7).
Figure 7
Source: Data.Medicaid.gov, 46brooklyn Research
This latest increase means that the price of Verapamil ER PM 300 mg Tablets have more than quadrupled since April.
Advance token to Boardwalk, Kremers.

What are you seeing?
While we spend more time than we’d like to admit studying the pricing changes during each NADAC Survey Results Week, we don’t always catch every story worth noting. Be sure to take a gander at all of our updated Visualizations that rely on NADAC prices. If you’re seeing any interesting movement on drugs in the dataset, let us know.
Thanks to the Massachusetts Independent Pharmacists Association’s Todd Brown for highlighting some of our recent Medicaid and Medicare Part D work in his opinion piece in CommonWealth Magazine last month.