Inside AWP: The arbitrary pricing benchmark used to pay for prescription drugs
With the holidays fast approaching, imagine for a minute, this scenario playing out. In order to better compete with Amazon, your neighborhood deep discount retail outlet (think Kohl’s, TJ Maxx, JCPenney) introduces a new customer loyalty program. Rather than paying the deeply discounted actual price for what you buy, you’ll get a fixed percentage discount off of overly-inflated (and largely meaningless) list prices of all the items you buy over the next year as a member of this new loyalty program. The only catch is that as a member, you have to agree to purchase all of your clothes and random chotchkies from this one retailer. Just add up the list price of everything you purchased (say, for a year), apply the fixed discount, and pay that amount.
Unfortunately there are two major problems with this type of program:
It is very complicated, which makes it very difficult for the customer to know if they are getting a good deal or not. Ultimately whether you get a good deal or not within this program simply depends on the gap between the list price and the discounted price for the items you purchase. But that can vary a lot depending on the product! If all of the products you buy have a small discount to list price, this program could make sense for you. But if you only buy products on the out-of-season sale rack (which already carries a very large discount to list price), it most certainly won’t. So to know if this deal will work in your favor, you would have to know the list-price-to-actual-price differential for all products in the store (very difficult to obtain, we imagine), and then forecast with high certainty exactly what you plan to buy over the next year. With this information and work, you can “solve” for whether or not you should participate in this program. Without it, you are going in blind.
The customer must trust that the retailer is looking out for his/her best interests. Let’s say a customer actually went through this exercise and figured out this was a good deal for them – what guarantee do they have that the retailer won’t simply raise list prices during the year to change the outcome? And what about new products? How will they model the differential for them? All of the customer’s modeling and forecasting work will be rendered useless if the retailer changes the variables to make the economics work out in their favor.
With problems like these, it’s no wonder why such a program doesn’t exist (and likely never will) in the highly transparent and competitive retail marketplace. In short, this is asking a customer to put a tremendous amount of faith in a for-profit retailer: setting up the customer to pay a fixed discount off of an unknown combination of meaningless, non-market-based, numbers. That’s one tough sell.
Unfortunately, this is not a fictitious construct when it comes to how you (or your employer or a state drug program) pay for generic drugs, where drug pricing guarantees are still commonly set based on a discount off of the Average Wholesale Price (AWP) standard (sometimes referred to as “Suggested Wholesale Price”) – a benchmark that is even more useless for generic drugs than list prices are for sale-rack clothing at TJ Maxx.
With so many drugs available, each with their market price that can change at any given moment, just thinking of all of the forecasting, modeling, and math that a large employer or government payer would have to do to figure out if they are getting a good deal makes our heads spin. With millions of covered lives that take a combination of thousands of drugs (each with a different AWP-to-actual-price differential), this problem is exponentially more complex than our fictitious loyalty program example, especially since we as consumers have a good general idea of what a shirt should cost, but have little idea of what a month supply of Lisinopril should cost.
With the exception of the smartest of payers (that are somehow solving this equation and “out-mathing” their PBM), when a payer enters a PBM contract based on AWP (especially with generic drugs), the payer is blindly handing the keys over to the supply chain to set the drug prices that the payer will get charged throughout the duration of their contract. Likely, this exchange is done in return for a guarantee that there will be some incremental financial improvement (or at least not a lot of degredation) versus the prior year. The PBM gets to keep its much-loved nebulous payment model while the payer gets to claim some incremental savings versus the wrong number paid the year before. It’s a win-win (not)!
The idea that this AWP-based model is concerning for payers is not new or original. Linda Cahn, President of Pharmacy Benefit Consultants, wrote in detail (a decade ago!) about all of the “mousetraps” embedded by the PBM in this sort of an agreement. While the discount to AWP that employers receive has certainly increased over the past 10 years, the model that Linda Cahn so eloquently described in 2008 has largely remained unchanged. Same model = same misaligned incentives.
So, this leads us to the question of what can a couple part-time drug supply chain researchers do to help advance this discussion? Well, we know we’re pretty good at creating visualizations, and this problem could certainly use a visualization to make it easier to “see.” As such, for the past couple months, we compiled data to create a visualization to help illustrate the problem that arises by anchoring generic drug costs to AWP. The finished product is embedded below.
The goal of the visualization is to assess how well AWP actually represents typical pharmacy acquisition costs (we used CMS’s National Average Drug Acquisition Cost - NADAC) for some of the most commonly dispensed drugs in managed care Medicaid. To do this, we selected 50 commonly dispensed generic drugs, and pulled three pricing benchmarks (NADAC, AWP, and Wholesale Acquisition Cost - WAC) for every National Drug Code (NDC), which is a fancy way of saying the unique product identifier for each drug (some drugs may have several NDCs associated with it). We then took all those NDCs and rolled them up into each of the 50 drug groupings. This gave us 50 “buckets” of drugs, each containing their own unique assortment of respective NDCs.
Please note that the pricing data we are presenting is a snapshot from mid-September 2018. But don’t fret over the two month “lag” in this dataset – using slightly dated data does not take away from the purpose of this dashboard (especially since AWP prices for generics rarely change). Its purpose is to illustrate the disconnect between pricing benchmarks which is an output of the system that has not materially changed since Linda Cahn penned her article a decade ago.
That said, here’s some user tips on what we’ve created for you:
The chart on the left plots the number of labelers versus the actual price “discount” off of AWP for each of the top 50 generic drugs. The discount is calculated as (1 - NADAC / AWP).
You can change the benchmark from AWP to WAC through the “Select Benchmark” drop-down filter at the top.
The chart on the right shows all of the labelers that distribute the chosen drug, and what their benchmark price was relative to NADAC in September. Simply click on any bubble in the scatter plot to update the table on the right.
To view all of the pricing data as a multiple to NADAC (benchmark price / NADAC) instead of the NADAC discount, select the second tab at the top left of the dashboard. NOTE: It appears that the ability to switch between tabs is not working properly in the visualization embedded above. To directly access the visualization on Tableau Public, where you can switch between tabs, click here.
Here are our key takeaways from this visualization:
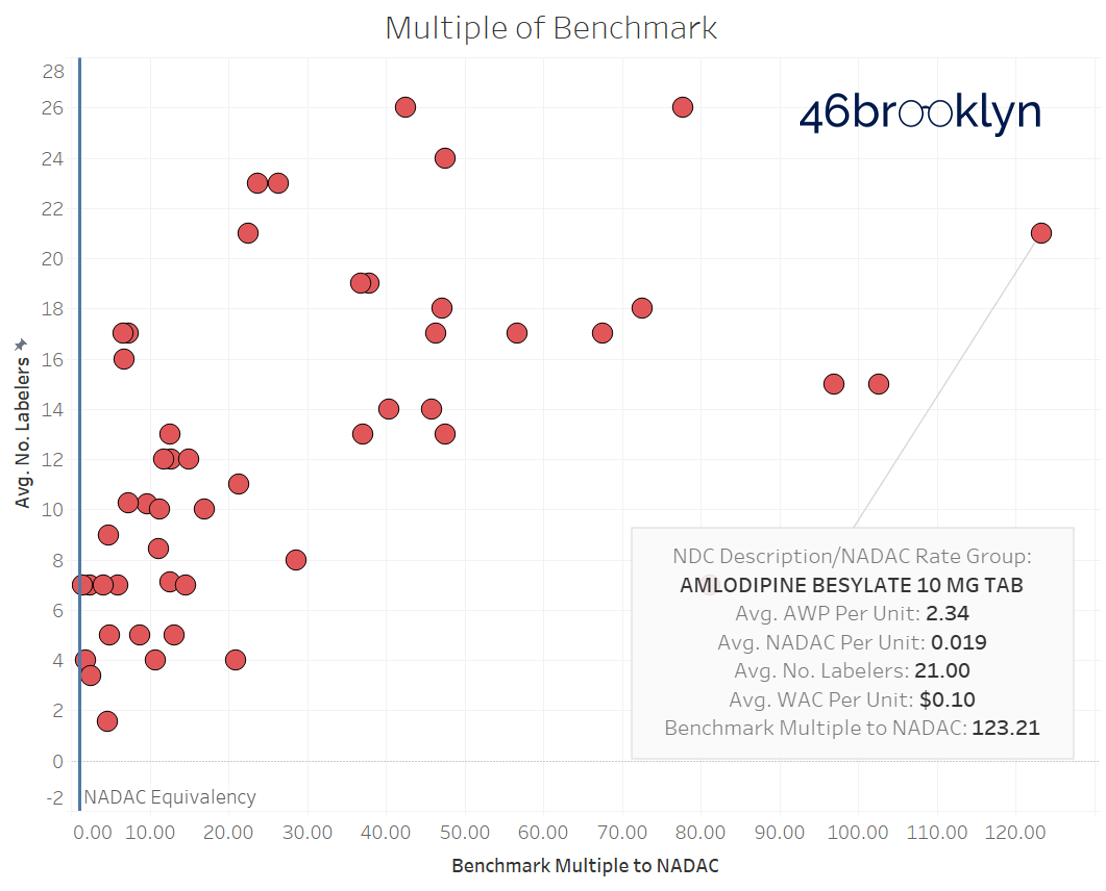
Not surprisingly, AWP and WAC have very little relation to actual NADAC drug prices. But we were surprised how egregiously disconnected pricing on some drugs are. The most striking example is Amlodipine Besylate 10 MG Tab, which carries an AWP that is an eye-popping 123x its NADAC (Figure 1)!
Figure 1
Source: 46brooklyn Research
We hear that the aggregate “discount” off of AWP ranges from the high-70s to the low-80s, depending on the size of the payer. On an individual drug basis, if the actual discount is less than this, the payer got a good deal. But if it’s higher, then the payer got a bad deal. You will see that most of these 50 generic drugs are well above an 80% discount to AWP, and as we learned from Myers and Stauffer and CMS in their NADAC Equivalency Metrics report, the more labelers in the market for a given drug, the higher the discount to AWP.
The labeler level view shows a surprisingly high level of “copycat” AWP pricing amongst different generic labelers. This could be a function of multiple labelers distributing the same generic from one manufacturer [key distinction: labelers are NOT manufacturers. You can have several generic drug labelers in the market, all distributing a generic with the same Abbreviated New Drug Application (ANDA)]. Or it could be a fallout of the current design of the supply chain. If the PBM is ultimately getting paid based on a percentage of AWP, why would it go out of its way to prefer a generic labeler that set its AWP well below the rest of the market? This would just eat into its profits. Against this logical backdrop we see very high AWP prices, that are eerily similar across labelers. Fascinating.
Figure 2
Source: 46brooklyn Research
Unfortunately, this dashboard brings up more questions than answers. But it should, at the very least, help reinforce that if you as a payer are willingly entering into an AWP-based contract, make sure you are ready to out-math your PBM, because the system is not designed for you to win. Or if you are looking for transparency and simplicity, consider moving to an acquisition cost-based model. Do the math. It may be better or worse than an AWP-based model depending on your specific drug mix. However, if you do decide to stick with the AWP-based model, please make sure to forget all about what we have written here – we’re not responsible for any insomnia stemming from the fear over how all of the “mousetraps” in this model are being parasitically exploited by the supply chain at your expense.


