
What do states pay for prescription drugs? Explore the CMS State Drug Utilization Database
Once a quarter, the Centers for Medicare and Medicaid Services (CMS) publishes detailed Medicaid spending data down to the National Drug Code (NDC) level through what’s known as the State Drug Utilization Database. On its own, it’s somewhat challenging to use due to poor drug naming conventions and the lack of any reference pricing. However, when merged with CMS's National Average Drug Acquisition Cost (NADAC) database, it comes to life! With this viz (a.k.a visualization), you can see the average invoice prices pharmacies pay for every medication, and then compare it to what the state is being charged. Have fun exploring the madness that is Medicaid drug pricing.
Data Sources
How we Created our Dataset
46brooklyn's visualization tool of choice = Tableau Prep
NADAC prices
Aggregate weekly NADAC into quarterly NADAC
Join SDUD and lag quarterly NADAC on NDC and Year-Quarter
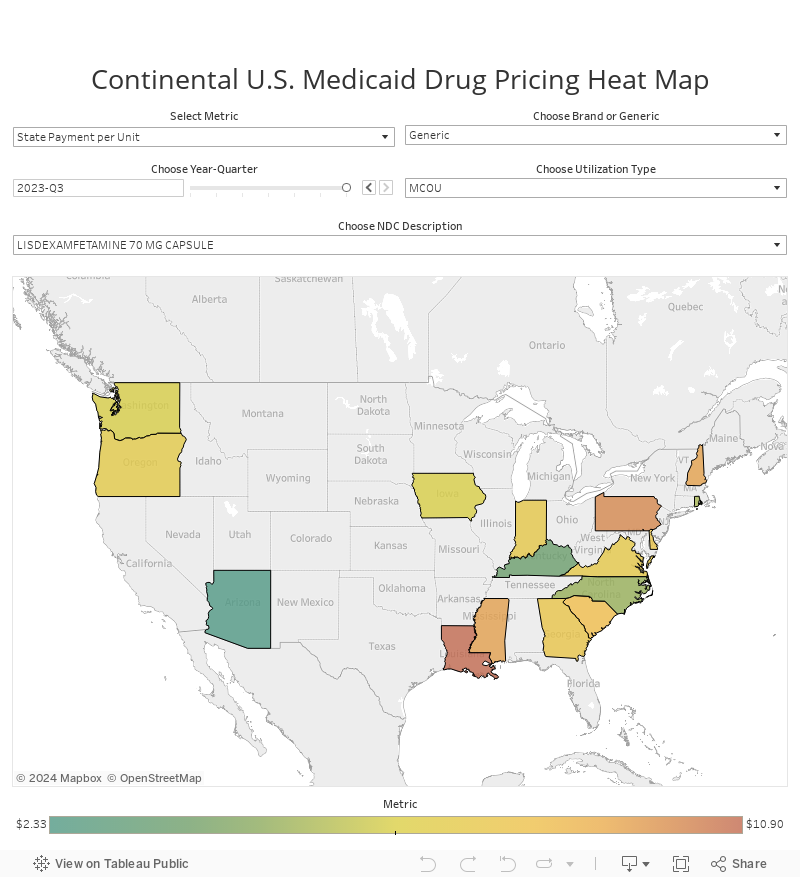
How to Use
Select the “metric” to view on the map - either State Payment per Unit or Markup per Unit
Choose brand or generic (generics are where PBMs are the “price-setters”)
Select the time period (Year / Quarter)
Choose the program type – Managed Care or Fee for Service
Choose a drug name from the list, or start typing one in
Hover over any state to see the time series of what was paid versus its NADAC (depending on your Internet connection, it may take a second or two for the charts to load)
Have questions on this viz? Check out the FAQ page. Don't see your question on the page? Contact us!
v 5.0 - posted July 22, 2025
For full release notes click here