
Express Scripts, Inc. vs. The Federal Trade Commission
Legislation, Litigation, and/or Competition
About a month ago, U.S. Congressman Jake Auchincloss posted on LinkedIn a potential Venn diagram of actions that may reform pharmacy benefit manager (PBM) practices in the United States (Figure 1):
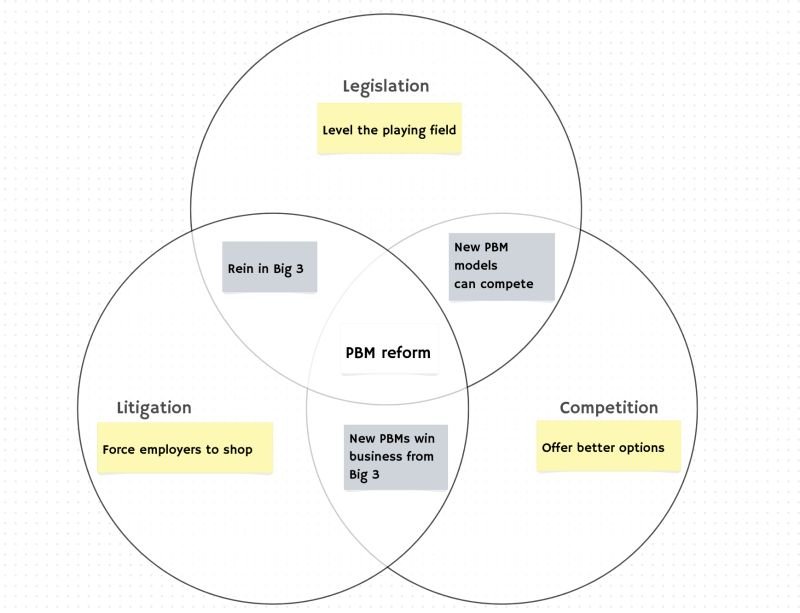
Figure 1
Source: Rep. Jake Auchincloss via LinkedIn
While the congressman viewed the pillars of PBM reform as either legislation, litigation or competition, Brian Reid over at the must-subscribe Cost Curve newsletter, picked up the baton and evolved the diagram a bit to bring in other potential forces that could begin to reshape the often-dysfunctional PBM marketplace (Figure 2).

Figure 2
Source: Cost Curve
As the prism with which to view potential PBM reform is evolving more and more into the old Seattle Supersonics logo, you get the idea – there’s a lot of opportunity. And while the majority of people in Congressman Auchincloss’ LinkedIn feed suggested that public policy was needed to reform PBMs, Brian Reid’s explicit added dimension of FTC-specific action was arguably a flavor of litigation that has become especially noteworthy this week.
This is because since that Auchincloss post and the alley-oop to Cost Curve, one of the largest PBMs in the marketplace – Express Scripts, Inc. (ESI) – has filed a lawsuit against the Federal Trade Commission (FTC) regarding the agency’s recent interim PBM report, which from this point forward, we will refer to as TFTCRTESWLDFTHB, or “The FTC Report that Express Scripts Would Like Deleted from the History Books”).
In their lawsuit, ESI is seeking judgement that it (ESI) was defamed by the report, that ESI’s right to due process was violated by the report, that the report be vacated and set aside by the Commission (see TFTCRTESWLDFTHB), and that the FTC itself is a violation of Article II of the US Constitution (note: this is not an all inclusive list of the demands sought). While this is by no means the first instance of a large PBM trying to erase specifics of their drug price-setting practices from the public domain, from our undereducated legal perspective, all that is contained within this ESI v FTC lawsuit sounds awfully serious. But such issues are undoubtedly legal in nature, thus beyond our scope of expertise to weigh in on. Rather, the nature of today’s report is to focus on one of the foundational pieces of evidence ESI offers in its lawsuit for how and why it was harmed: The Carlton Report.
What is The Carlton Report?
As stated on the report’s landing page, University of Chicago Professor Dennis Carlton has for several months been studying the data from the largest PBMs – including what is stated to be the data provided to the FTC by the big 3 for the FTC’s PBM investigation. From this several month study of the PBM-supplied data and information, the highly sought-after and incredibly successful professor produced a report which works to contradict many of the inferences drawn by The FTC Report that Express Scripts Would Like Deleted from the History Books. To be clear, ESI appears to be relying upon (11 footnotes [by our count] in their lawsuit reference this one report) the Carlton Report, because across his 17 pages of analysis, Professor Carlton reaches a lot of conclusions that do appear to conflict with the 73 pages of the FTC report (ergo they support ESI in its lawsuit to the degree it alleges factual inaccuracies within TFTCRTESWLDFTHB). Given that this Carlton Report is such a cornerstone of the PBM industry’s defense against the FTC’s inquiry – and because it is so critical that it even got its own special web domain, landing page, and cool-sounding name – we thought we would take 24 hours to digest the Carlton Report’s conclusions one at a time and explain what was going through our head as we read each and every one.
Note, the Carlton Report is just 17 pages long (and its mostly graphs and tables, not a lot of words) – we strongly encourage you to read it and reach your own conclusions before reading our thoughts (he’s an economist; we’re not – we’re bound to potentially see things differently, and it’d be best if you had a base understanding of what Professor Carlton said before we begin what is going to be a deep dive).
…
So assuming that you’ve read the Carlton Report, let’s dive in (but don’t hold your breath as this is going to be a long report) and give you our initial impressions.
Carlton Report Analysis #1: Claims that PBMs are earning excess profits that have been increasing over time and are responsible for high drug prices are not supported by the data on PBM margins.
The first analysis conducted within the Carlton Report is an examination of PBM profitability over time. Relying upon data from the largest PBMs, Professor Carlton concludes that “PBM operating margins are below 5%“, and “Even if plan sponsors paid PBMs only enough to cover their operating costs of providing services….drug costs (plan sponsor payments plus member copays) would only be reduced by less than 5%.“
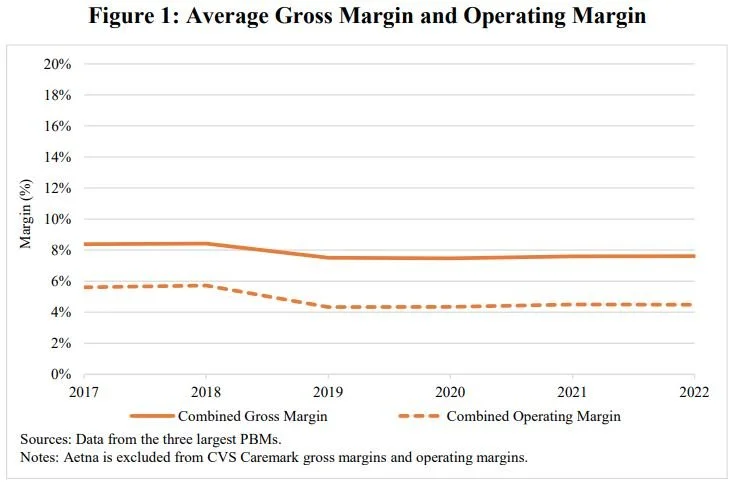
Figure 3
Source: The Carlton Report
Interestingly, the reported profit margin of PBMs is something that has been previously investigated. In fact, back in 2017, Bloomberg reporters Tom Metcalf and Neil Weinberg analyzed PBM margins in “Drug Middlemen Have Slim Profit Margins - Just Ask Them”, where it was revealed that PBMs appear to consider themselves principals – not agents – in handling their customers’ transactions. Now, we’re not accountants, but our understanding is that the main difference between a principal and an agent is whether the entity controls the good or service before it's transferred to the customer. The fact that PBMs consider themselves principals allows them to take advantage of accounting principals that means when they tally their sales, PBMs “book the entire value of the drug transaction as revenue.”
If this seems really in the weeds, it undoubtedly is, but think of it this way. When a PBM transacts a claim for say Walgreens (a pharmacy not owned by any PBM), it gets to take all the money it pays Walgreens into its financial books (even though the PBM never actually touched the product dispensed). As the Bloomberg analysis said back in 2017, if these “pass-through” revenues were stripped out, ESI’s “operating margins [would] more than double to 15 percent”.
“The analysts say these companies benefit from ‘lack of transparency and misaligned incentives,’ the latter because they benefit from higher drug prices. Historically those dynamics have been great news for shareholders.”
What’s more, when Charley Grant at the Wall Street Journal investigated PBM profits in 2018, in “Hidden Profits in the Prescription Drug Supply Chain,” not only did the Journal also highlight the same issue with including the cost of drugs within PBM revenues, they added to the understanding by highlighting how PBMs converted 85% of their gross profit into EBITDA over the prior two years. By comparison, the WSJ found that drug distributors converted 46% of their gross profit, while health insurers and pharmacies achieved about 30%. These past articles were top of mind as we reviewed Professor Carlton’s first conclusion.
Now, it’s important to note that Professor Carlton’s methods in this analysis are unstated, and thus, unknown. We cannot know if he relied principally upon PBM reporting of these margin figures alone or if he reached his conclusion above via some other means (i.e., reached the conclusion that the PBM accounting principals were correct, sought to validate the PBM’s statements by testing them against alternative methods of his own design, and then arriving at his results, etc.). Nevertheless, for members of Congress like Rep. Auchincloss, we wonder if this is not a signal of some of that policy work that could be done. Should public policy regulate how PBMs keep their books to better understand their business model? Are there tax or investment implications or other broader nuances that can be impacted by these accounting methods?
Alternatively, we wonder if the decision to categorize oneself as a principal may backfire to a degree within this lawsuit. As we generally understand the Financial Accounting Standards Board (FASB), one of the ways that the principal determination is made is pricing discretion. As defined by FASB, an entity may be appropriately categorized as a principal, and not an agent, “if the entity has [pricing] discretion in establishing the price that the customer pays, it serves as an indicator that the entity obtains substantially all the benefits from the specified good or service, and therefore has control over it.“
If PBMs are considered principals, and they do have control over the price that their customer pays, does that not in some way undermine their statements that drug manufacturers, and drug manufacturers alone control drug prices? (Note, we think [not lawyers] ESI makes this point in their lawsuit against the FTC). PBMs certainly wouldn’t seem to bare inventory risk (which is another test in the principal vs. agent determination, as we read up on it). They (PBMs) further would not seem to be the primary party responsible (the third test for the principal designation) for fulfilling the claim for the same reason (the dispensing pharmacy fulfills the drug order from the doctor – note The Carlton Report will itself later make the point that retail pharmacies represent 85% of prescription fills, which we view as further confirmation of this lack of fulfillment role).
As you will see, as we try to interpret The Carlton Report’s findings, this lack of detail on the methods with which the conclusions are based upon will leave us more than a little puzzled as we try to understand his findings.
Carlton Report Analysis #2: Claims that PBMs do not benefit plan sponsors because PBMs do not pass through the negotiated rebates and administrative fees from drug manufacturers to the plan sponsors are not supported by the data on rebate pass-through rates.
The next claim evaluated by Professor Carlton was whether PBMs are passing on rebates to plan sponsors. As identified by Professor Carlton, “The three largest PBMs pass through the vast majority of rebates and administrative fees they receive from manufacturers to plan sponsors.“

Figure 4
Source: The Carlton Report
While the footnote of this analysis provides a little bit more detail into how the conclusions were arrived at compared to the prior analysis (for example, we know that Optum Rx admin fees were not included until 2019 – for whatever reason), details are lacking on what is and is not considered a “rebate” or “administrative fee” for the purpose of this analysis. Without greater details into the definition of these items, we question what the analysis of “passing through” is actually measuring. This is important, as Ed Silverman at STAT News reported in his 2018 piece, “Never mind the rebates. Maybe behind-the-scenes fees are boosting drug prices”, dollars received by PBMs from drugmakers were increasingly being recategorized as an assortment of fees that by virtue of their reclassification in contracts could result in those dollars being considered not subject to disclosure and/or pass through requirements.
“This is part of the whack-a-mole in drug pricing, because we regulate rebate disclosures, but the system has found an alternative way to make money in the form of fees.”
This approach of using miscellaneous fees as a means to undermine the spirit of pass-through rebate contracts isn’t the only tool in the PBM toolbelt, of course. Around the time that the federal government put a target on the anti-kickback statute that enables modern drugmaker rebating practices, PBMs began architecting new sister companies called group purchasing organizations (GPOs) or rebate aggregators as another method of collecting increased drugmaker price concessions with an arguably even improved ability to retain those discounts within the larger PBM parent organization without having to pass them through to clients.
As way of example, with a real-life Express Scripts customer, a recent Office of Inspector General audit of the American Postal Workers Union Health Plan found that Express Scripts was not, among other things, passing through all of the drug manufacturer’s price concessions in 2019 and 2020 (years which overlap The Carlton Report). Interestingly, the audit found issues with rebate withholds by both Express Scripts and their sister company Ascent Health Services (both of which according to the OIG postal workers union audit seems to have resulted in ESI paying additional money back to the plan). A similar revelation was made in Illinois, where this summer, it was alleged that CVS Caremark “unlawfully deprived the state” of rebates that were owed under a state employee plan. While CVS reached a settlement with the state for $45 million, the settlement agreement stated that the PBM and the other CVS entities denied the allegations, so do with that what you will.
The point here is that an assessment that seeks to measure the degree that “rebates” and “administrative fees” are passed through isn’t as straightforward as it may seem (or as we may like). Thus an accurate accounting of what is and isn’t a rebate or a fee or whatever else drugmaker price concessions could be labeled is an important starting point for any analysis that would seek to reach conclusions on how the various things of value between manufacturer and PBM and plan sponsors were handled. Further, if any of those rebates, fees, or other things of value are not being accounted for and tracked at the PBM sister company level (whom PBMs seemingly ceded authority in this space too; see comments later related to GPOs), then claims that PBMs may be passing on all or even a majority of drugmaker price concessions would be undermined by a lack of completeness of information and would be disingenuous, at best.
We do not know what consideration Professor Carlton gave to the various ways fees may be characterized as “administrative” or otherwise (dozens of potential fees can exist), nor do we know if Professor Carlton’s access to data included those of the PBMs’ GPOs (of which all the big 3 now have; and often have in conjunction with their smaller PBM competitors).
Such reporter-derived learnings, audits, and settlement findings certainly seem to contrast with Professor Carlton’s conclusions about PBM activity for reasons unknown and unaddressed by his report.
Carlton Report Analysis #3: Claims that the amount that plan sponsors pay to PBMs for a prescription far exceeds the amount that PBMs pay to pharmacies (this difference is often referred to as the “retail spread”) are not supported by the data.
The next claim evaluated by Professor Carlton was to investigate “spread pricing” by comparing the difference in the amount that plan sponsors pay PBMs for a prescription drug relative to the amount the PBM pays the pharmacies. Professor Carlton concluded that “the average retail pharmacy spread retained by PBMs is below 2%.“

Figure 5
Source: The Carlton Report
Again, we do not know the exact manner in which Professor Carlton conducted this analysis. The decision to exclude CVS from Caremark is itself somewhat noteworthy – as CVS represents approximately 23% of the retail pharmacy market (per CVS’ financial filing) – as is the decision to compare it across all plan sponsors (rather than say across commercial, Medicare, and Medicaid). Breaking out spread would have been particularly interesting, as state Medicaid programs have generally been clamping down on spread, and spread doesn’t/shouldn’t exist with DIR reporting. Said differently, it would seem worth knowing how successful Medicaid’s clamp down on spread pricing has been by seeing it individually called out, as well as being able to see whether commercial has grown, stayed the same, or declined overtime.
Nevertheless, what is interesting is that the timeframe analyzed by Professor Carlton aligns to the same timeframe that state auditors, attorneys general, and others sought to analyze spread pricing practices of PBMs – predominantly through their state Medicaid programs. This is something that these resident authors have great familiarity with, as it was our early work prior to the launch of 46brooklyn that acted as the catalyst to uncover the sheer magnitude of the spread pricing phenomenon in the Ohio Medicaid managed care program back in 2018. More on that journey here.
The findings of those follow-on spread pricing audits and investigations again do not appear to align with Professor Carlton’s conclusions. For example, “an analysis conducted by Auditor Yost’s staff found PBMs collected $208 million in fees on generic Medicaid prescriptions, or 31.4 percent of the $662.7 million paid by managed care plans on generics during the one-year period April 1, 2017 through March 31, 2018.“ The findings of Dave Yost’s Ohio audit principally cover the actions of CVS Caremark and OptumRx (the two dominant PBMs within the Ohio Medicaid program at the time). Yost’s audit was far from the only one during this time frame – Kentucky ($124 million), Maryland ($72 million), Florida ($113 million) – and yet the Carlton Report would suggest that maybe spread pricing was only being taken out of Medicaid programs…?
We, of course, know that spread pricing is not a Medicaid-only phenomenon. As way of another example, with a real-life ESI customer, the OIG audit of American Postal Workers Union Health Plan also found more than $12 million in retail pharmacy spreads that were not being passed through, even though they were expected to be.
To be clear, if $208 million in Ohio Medicaid spread is to equate to 2% (as per analysis of Professor Carlton above), that means that $200 million would have been measured against $10 billion in Ohio Medicaid pharmacy expenditures. However, the Ohio Medicaid program has never expended $10 billion for its pharmacy program (not even during the COVID-19 pandemic; measured as of August 2024; and at the time of the spread pricing audit [Q2 2017 through Q1 2018], Ohio Medicaid was expending closer to $3 billion annually on prescription drugs). Again, Yost’s Ohio audit was just one of a half-dozen or more state audits that found similar spread pricing issues during the 2017-2019 timeframe. Either all those audits by all those government agencies got it wrong, or something appears wrong with Professor Carlton’s math. A separate group of researchers, those at Nephron, have found PBM spreads to be a larger historical source of profits for PBMs than Professor Carlton’s report would seem to acknowledge (we cannot know, but assume Nephron’s methods differ from Professor Carlton’s).
“We were sitting around one day looking for ways to generate more revenue and the C suite kept pushing us for more and more, ... That was my employer trying to squeeze more and more and more dollars.”
Knowing the math on how “spread” is calculated is important. Is this the traditional form of spread – the direct difference between what is paid to the pharmacy on the claim compared to what is billed to the health plan on the same claim – or does this also cover more modern evolutions of spread via effective rates and other forms of retrospective reconciliations that may not actually change the price on the claim (to enable that direct claim-to-claim comparison)?
We know that traditional forms of spread pricing may have morphed into more effective rate-styles in the same time frame that Professor Carlton is studying. This occurs when a pharmacy is paid a higher amount than what their PBM contract requires, with the excess amounts reconciled or clawed back later, without those discounts being disclosed or passed through to the plan. Ohio learned this lesson the hard way after they prohibited spread pricing years ago. Due to the sheer magnitude of spread pricing, it would be helpful to know what type of analysis led to Professor Carlton’s conclusion in this matter.
We presume that calculations of “spread” are potentially difficult to make; after all; not all PBM relationships are direct. Was it the PBM in the Ohio audit responsible for spread or was it the managed care organizations (MCOs)? If the PBM and the health plan MCO have common ownership, can the “spread” issue be shifted away from the PBM and pinned on the health plan? We have no idea what sort of financials were used to base the above calculation and conclusion upon in the Carlton Report, but again, it would not seem to align with what we know transpired based upon other investigations into spread over the same timeframe.
Carlton Report Analysis #4: Claims that PBMs’ negotiation of rebates from drug manufacturers leads to a higher growth rate in list prices for rebated drugs are not supported by the data on rebates and list prices.
The next claim evaluated by Professor Carlton was whether or not rebates lead to higher brand drug list prices. Professor Carlton concludes that “data show that list prices of rebated drugs are not systematically increasing at a higher rate than list prices of non-rebated drugs.“

Figure 6
Source: The Carlton Report
This analysis is interesting to us for a number of reasons. First, the limited insights that were given into how the data was analyzed suggest that it relied upon two of the big three PBMs’ data. Why? Was it because one of the big three PBMs did not provide data to the FTC (i.e., not fully compliant with the FTC’s ask; the thought being if they got it from two, it was likely because they asked for it from all three – not because it was given without being asked for)? Was Professor Carlton not supplied all of the information and data that was supplied to the FTC (hence he had to go with the only two data sources he had)? Or was it because inclusion of the third may have led to a different conclusion (maybe their data wasn’t formatted the same or made different assumptions regarding what was or wasn’t rebate-able)? Or maybe other reasons can explain why and how this result was reached.
Regardless, PBM rebate arrangements are considered to be some of the most closely-guarded secrets in healthcare, with extreme lengths taken to protect their true nature. As such, the details unequivocally matter. For example, just because the two PBMs whose data was relied upon here didn’t get rebates on a set of brand name drugs doesn’t mean that same set was associated with no rebates. For example, all brand manufacturers and their associated drugs (here is a Medicaid database that tracks participation) to our knowledge provide a minimum 23.1% rebate (to AMP, not WAC) to Medicaid programs nationally with a healthy extrapolation of those discounts given through the 340B program. How can the relationship between rebates and list price be appropriately assessed if not all rebate activity for the brands being analyzed is known or potentially measured?
We do know that the above does not appear to have any sort of statistical analysis or p-value which seem to support the conclusion reached. We also know that this is a question other researchers have looked at and investigated (again over the same approximate timeframe). The USC Schaeffer institute has published findings (back in 2020), again covering some of the same years that Professor Carlton’s data is looking at, that reach the opposite conclusion.
Carlton Report Analysis #5: Claims that PBMs’ negotiation of rebates from drug manufacturers leads to a higher growth rate in list prices for rebated drugs with higher rebates are not supported by the data on rebates and list prices for individual drugs.
The next claim evaluated by Professor Carlton was related to the claim above, but rather than look at the rebate-list price relationship in the aggregate, Professor Carlton moved to examine individual drugs. The result of this analysis led Professor Carlton to conclude that “there is no statistical evidence that rebate percentages are positively correlated with the rate of growth in list prices.“

Figure 7
Source: The Carlton Report
While the USC Schaeffer research we already presented suggests some level of disagreement on what conclusions can be reached regarding rebate-to-list price relationships, we are more interested in Professor Carlton’s outline methods (to the degree that they’re outlined) for this analysis. In Figure 7 above, it states that the observations are weighted using the number of 30-day prescriptions. We wonder why. If the goal is to measure the relationship between list price change and rebate change, what rationale supports weighting the analysis by number of prescriptions? We bring it up because we have a concern about confounding variables, given that the very nature of rebates is designed to change prescription dispensing patterns. Said differently, a rebate (thing of value) is given in exchange for formulary placement (another thing of value) with the idea being that securing better formulary placement will lead to better manufacturer rebates (i.e. pay to play). If successful, then arguably giving more rebates can yield even better formulary placement/treatment and thus, even better utilization/volume.
By weighting the observations against prescriptions, an analysis seeking to measure rebate-to-list price relationships may actually measure the degree to which giving rebates secures improved utilization of the drug. We believe this is true because the financial statements of drug manufacturers tell us that this exchange of value is an important consideration for their businesses. Consider, for example, Bristol-Myers Squibb (BMS), the company responsible for Eliquis (the number one drug by gross expenditures within Medicare). According to BMS’ financial fillings (our own emphasis added), “To successfully compete for formulary position with MCOs and PBMs, we must often demonstrate that our products offer not only medical benefits but also cost advantages as compared with other forms of care. Exclusion of a product from a formulary can lead to its sharply reduced usage in patient populations due to higher out-of-pocket costs to patients. Consequently, pharmaceutical companies compete aggressively to have their products included on these formularies. Most new products that we introduce compete with other products already on the market or products that are later developed by competitors. Where possible, companies compete for inclusion based upon unique features of their products, such as greater efficacy, better patient ease of use or fewer side effects. A lower overall cost of therapy, usually provided as a rebate to the PBM, is also an important factor. Products that demonstrate fewer therapeutic advantages must compete for inclusion based primarily on price.“
In their lawsuit against the FTC, ESI states that that their formulary development process is overseen by both a P&T Committee as well as a Value Assessment Committee (VAC), but provides no details on how many drugs the P&T Committee requires ESI to include compared to how many drugs are given the “optional” designation (subject potentially just to a price consideration if the BMS 10k filing is to be believed). Said differently, we don’t know how many decisions are made based upon clinical merit alone, cost merit alone, or some combination of both. But clearly the distinction matters in order to determine how valuable gross price vs. net price is. For example, what would an alternative analysis by Professor Carlton have looked like if he excluded from his analysis all drugs designated as “include” by P&T or focused only on drugs flagged as “optional” (presumably during the years where they were optional – if that designation changes over time). Such sub-analysis may provide a different view on the phenomenon compared to what was observed. The opacity of coverage decisions may be further compounded (i.e., another variable that needs considered) by the role of the PBM GPOs, which undoubtedly play a role in determining net price price for the VAC analyses (and maybe in what offers are available for coverage - i.e., allowable tiers &/or prior authorization criteria).
Alternatively, the ESI lawsuit also states that the PBM negotiates both “rebates” and “price protection” from brand manufacturers. Did Professor Carlton’s analysis consider all drug manufacturer revenue in reaching its conclusion, or just those flagged as “rebates”? And why does this analysis, if the title is to be believed, focus just on rebate and not the “administrative fees” (considering his earlier analysis focused on both)? If the PBM got other monies to offset list price increases but they were not considered in evaluating the role of list price changes, then perhaps the difference between Professor Carlton’s current work and the historic work of USC Schaeffer is one that comes down to semantics (and should PBMs really be allowed to differentiate price protection as not a form of rebate – if that is even what they’re doing here?).
Carlton Report Analysis #6: Claims that PBMs’ negotiation of rebates from drug manufacturers leads to a higher growth rate in overall net drug prices paid by plan sponsors and members are not supported by the data on rebates and overall net prices.
The next claim evaluated by Professor Carlton was to examine whether plans and patients are harmed by rebates. He conducted this analysis by examining trends for rebated and non-rebated brand drugs and concluded that “overall real net price paid by plan sponsors and members for rebated, branded drugs decreased over time while the overall real net price paid by plan sponsors and members for non-rebated, branded drugs increased over time.“

Figure 8
Source: The Carlton Report
Again, for reasons unknown, Professor Carlton’s analysis relies upon data from two (not three) of the PBMs to reach its conclusions. Again, this aggregate analysis contains no statistical details to support the conclusions derived. We wonder how the identification of a rebated brand drug was determined when they may not agree PBM-to-PBM or even within a PBM (as ESI’s lawsuit notes, 66% of members in plans using Express Scripts were on a custom formulary in 2022). How those differences were accounted for in this analysis are unknown without an examination of the methods, which are not evident.
However, we are not sure those are the most interesting observations. Rather, we wonder about the decision to measure the results in the aggregate of both “plan sponsor and members” rather than separate (or individually as well as aggregate). We wonder this because rebates are almost certainly beneficial to the plan (see Money from Sick People), but it may be the case that members would have paid less had rebates not been collected retrospectively. We know from CMS’ review of pharmacy DIR (i.e., pharmacy-derived Money From Sick People) that “higher point-of-sale prices generally result in higher beneficiary cost-sharing obligations.” It stands to reason that if the drug with a rebate had the rebate recognized at the point-of-sale, then patient cost would go down (just like they were to go down following pharmacy DIR reform and are to go down Medicare consumers following IRA price negotiation [per CMS]).
It also stands to reason that the plan collecting the rebate may not share the full value of that rebate with the member (such as in the deductible phase of coverage) and so this analysis may benefit from component costs being considered separately rather than together. As way of demonstrating why in a less abstract way, PBMs can make cost sharing and copayment amounts a required part of rebate considerations. In MedImpact’s publicly-available contract for the City of Mesa, claims where the eligible member pays more than 50% of the cost of the claim outside of the deductible or 100% eligible member copayment are not eligible for rebates. Said differently, there are links between benefit design choices and rebates that may need to be considered as confounding variables to an analysis of the rebate vs. non-rebate analysis presented above to say nothing of PBM requirements that tie rebate payments to adoption of PBM-designed formularies.
Carlton Report Analysis #7: Claims that the largest PBMs face no competition are not supported by the data on shares.
The next claim evaluated by Professor Carlton was the degree to which PBMs are competitive with one another. Professor Carlton concludes that based upon his analysis of covered lives whose pharmacy benefit services function are managed by the big three PBMs, “the three largest PBMs’ share in each function shown here has been steady or has fallen over a six-year period.“

Figure 9
Source: The Carlton Report
While Professor Carlton appears to provide greater insight into his methods for this analysis, with more footnotes and explanations than prior sections (e.g. “smaller PBMs perform many functions themselves but subcontract claims processing to one of the three largest PBMs”), we are not sure such an analysis is sufficiently comprehensive.
To start, you will see that as a footnote to his analysis, Professor Carlton is not considering the role of “carved out” lives. This is potentially problematic given that it appears that the majority (57%) of plan sponsors carve out their drug benefits. Ergo this may not consider the majority of the market. What is more is that if we consider the observations made here against some of the observations within the Carlton Report, we wonder whether it is actually demonstrating competition as opposed to market contraction.
Consider the observation that rebate negotiation was 59.1% handled by the big three in 2018 but is now 38.7% handled by the big three in 2023 (second column in Figure 9 above). Is that a result of a competitive PBM market or the fact that PBMs have largely ceded rebate negotiations to newer subsidiaries – the PBM GPOs that exist for each of the big three PBMs. What’s more is that industry observers have noted that PBM rebate negotiations within these GPOs appears to be more consolidated than competitive, as the big three PBM GPOs are actually representing their competitor PBMs – as well as their own interests – when negotiating rebates with manufacturers (Figure 10).

Figure 10
Source: Drug Channels Institute
The point being, is the fact that this function trended downward a sign of competition (as Professor Carlton concludes) or a sign of potential consolidation? Let’s presume Figure 10 represented the rebate market activity pre-GPO. The fact that 15 PBMs are now using three GPOs would suggest not a more competitive market (the conclusion we believe Professor Carlton is drawing by saying that functions are flat or declined), but rather the fact that while there used to be 15 (of which the big three were just a part of the market), there are now just three (in part because we’re not measuring this as a direct PBM function, but due to a new intermediary).
As way of potentially evaluating which direction this is going, we figured we would look at some of the annual financial filings of other drug supply chain participants. The aforementioned drug manufacturer BMS states that the big three PBMs (Optum (UHC), CVS Health (CVS) and Express Scripts (ESI) control 80% of the prescription market. Or perhaps we can rely upon the financial statements of the pharmacy chain Rite Aid, which notes “A substantial portion of our pharmacy revenue is currently generated from a limited number of third-party payors. While we are not limited in the number of third-party payors with which we can do business and results may vary over time, our top five third-party payors accounted for 83.4%, 77.4% and 77.9% of our pharmacy revenue during fiscal 2023, 2022 and 2021, respectively. The largest third-party payor, CVS/Caremark, represented 33.4%, 32.1% and 30.4% of pharmacy sales during fiscal 2023, 2022 and 2021, respectively.“ Or perhaps we can rely upon the shorter statements of Walgreens that warns investors about the risk to its business by stating “We derive a significant portion of our sales in the U.S. Retail Pharmacy segment from prescription drug sales reimbursed by a limited number of pharmacy benefit management companies“.
The data and financial statements of drug manufacturers and pharmacy chains seems to suggest a great deal of consolidation has occurred with PBMs that Professor Carlton is unable to find. Saying it differently, are all these other market participants getting it wrong on their financial disclosures to the public on the degree of consolidation they face?
Carlton Report Analysis #8: Claims that independent pharmacies are disadvantaged relative to non-affiliated chain pharmacies – because independent pharmacies receive lower reimbursement rates than non-affiliated chain pharmacies for the same drugs – are not supported by the data on reimbursement rates.
The next claim evaluated by Professor Carlton was that PBM-affiliated pharmacies are not advantaged financially compared to non-affiliated or independent pharmacies. Professor Carlton concludes that, “reimbursement rates paid to independent pharmacies are generally higher than the reimbursement rates paid to non-affiliated chain pharmacies for both non-specialty branded drugs and non-specialty generic drugs“

Figure 11
Source: The Carlton Report
Interestingly, Professor Carlton’s report looks at non-specialty brand and generic prescriptions and limits his observations only to those claims where at least 100 30-day prescriptions for each are filled. First, The FTC Report that Express Scripts Would Like Deleted from the History Books had an analysis of two specialty generics (ESI acknowledges this analysis in their lawsuit - refers to analysis of two drugs) that found billions in profitability associated with these drugs for PBMs and their affiliated pharmacies. We’ve explored the specialty drug definition and pricing distortions at length, and that work is actually cited in the FTC’s report. Why the Carlton Report pharmacy margin analysis was conducted in a way that avoided specialty drugs is the first thing we questioned when reviewing this conclusion.
For example, we know that limited pharmacy networks can be highly successful at blocking non-affiliated pharmacies from dispensing medications. In analyses done at 3 Axis Advisors (disclosure: 3 Axis is the professional home of the 46brooklyn team), many state reports have shown that despite retail pharmacies getting to dispense drugs associated with small profits (or even losses), the most profitable drugs – which are commonly specialty drugs – are often not proportionally dispensed to an equitable degree by non-PBM-affiliated pharmacies. In essence, by constructing an analysis that required the drug to be filled to a reasonable degree (at least 100 observations in the various constructed buckets) at the competitor pharmacy and overlooking the known areas where the most financially rewarding medications are filled, we wonder just how deep and meaningful of an analysis was conducted on the matter?
To use someone else’s words in trying to explain why this analytical approach is so interesting, the Cigna Group Investor Day presentation, (Cigna is ESI’s parent company) the organization highlighted its position within specialty pharmacy as a key driver to future growth, noting how the specialty market is larger than even the Medicare Advantage market and that they already have a market share of 25%. If the PBM parent company is telling you specialty is important – you ought to have to look at it for an analysis seeking to measure equitable payments, right?

Figure 12
Source: Cigna Investor Day presentation
Carlton Report Analysis #9: Claims that independent pharmacies are being driven out of business by PBMs are not supported by the data on retail pharmacy locations.

Figure 13
Source: The Carlton Report
The next claim evaluated by Professor Carlton was to examine whether PBMs appear to be driving retail pharmacies out of business. Professor Carlton concludes that PBMs do not have a financial incentive to drive pharmacies out of business and that the data demonstrates that independent pharmacy locations have grown between 2011 and 2021 whereas chain stores have decreased.
Based upon the data presented, Professor Carlton does not appear to have reached this conclusion based upon his own evaluation of data as submitted by the PBMs but rather based upon the work of the University of Iowa (we’re assuming this study since Professor Carlton didn’t specify).
While Professor Carlton could not have considered it at the time of publishing his report (as it was not published at the time of his report), pharmacy data extraordinaire Benjamin Jolley recently performed an in-depth analysis of pharmacy openings and closings for 2024 and has found that there are fewer pharmacies now than at the start of 2024 (2.8% fewer locations per his report). As he notes in his report, pharmacies have a much greater incentive to report their openings into NCPDP (to secure their NCPDP ID) than to report their closing, which can mean a reliance upon NCPDP data alone to analyze openings and closings is bound to underestimate closings (an assessment we think is very astute).
To our knowledge, Benjamin Jolley is the only one to take such a comprehensive look a the trends of late, and as such, his conflicting conclusions of the rate of pharmacy location growth or contraction probably bears further scrutiny before making conclusions about the number of pharmacy locations over time (particularly if those conclusions were reached based upon 2021 data).
Carlton Report Analysis #10: Claims that PBM practices are disadvantaging independent pharmacies relative to chain pharmacies are not supported by the data on independent pharmacy and selected chain pharmacy gross margins.
The next claim evaluated by Professor Carlton was to evaluate potential pricing disadvantages of independent vs. chain pharmacies. Professor Carlton concluded that because independent gross profits have not declined, both over time and relative to large chains, that harm does not exist.

Figure 14
Source: The Carlton Report
We have already commented on the dangers of relying upon a gross profit margin number without knowing how it has been derived (see PBM gross profit discussion earlier). As above, so here below, we note that it is concerning to draw too much of a conclusion from the above analysis (and to be fair, Professor Carlton acknowledges it may not be appropriate to compare his report’s Figure 8 and 9 to each other).
Nevertheless, to demonstrate how a percentage-based measure can potentially lead us astray, consider the concept of negotiating a contract where we promised you that your gross profit margin would be flat over the next five years. You may say that’d be great, but what if, as a function of securing this contract, your average price of goods sold declined such that although your profit margin percentage is maintained at 20%, your revenues are going down as a function of you having and managing ever-cheaper products. Said differently, 20% of $100 is less money than 20% of $1,000. Alternatively, what if you’re getting less volume over time as a result of steerage, such that again although you maintained a top line gross profit number that was more or less equal, your revenues are down year-over-year. While these examples are theoretical here, we have seen independent pharmacy financial statements that bare out these trends (though we cannot draw national trends from the experience of a few pharmacies).
If it is true that PBMs are increasingly excluding some of the most lucrative drugs from being filled at retail pharmacies because of PBM steering activities (see House Oversight Committee report in addition to TFTCRTESWLDFTHB), then wouldn’t it also be true that profits on a pharmacy's prescription claims could be unchanged in the aggregate while still facing increasing financial headwinds? Saying it differently, analyses have demonstrated that a relatively small percentage of claims are responsible for a large share of pharmacy profits. If the share of those most lucrative scripts declines, the financial harm to a community pharmacy can be significant (resulting in a quick exit from the pharmacy business).

Figure 15
Source: 3 Axis Advisors
Carlton Report Analysis #11: Claims that PBMs’ mail-order pharmacies are growing at the expense of non-affiliated retail pharmacies are not supported by the data on prescriptions filled.
The next claim evaluated by Professor Carlton was to examine whether prescription growth is occurring more rapidly at PBM-affiliated pharmacies vs. non-affiliated pharmacies. Professor Carlton concludes that, “the non-affiliated retail pharmacy share of prescriptions for non-specialty drugs is substantial, around 85%, and has remained steady over time.“

Figure 16
Source: The Carlton Report
Once again, Professor Carlton excludes specialty drugs from his analysis despite specialty being a key source of big three PBM financial growth (see the aforementioned investor presentation given by the Cigna Group and see Nephron Research chart towards the end of this report). Further, by focusing on number of prescriptions, Professor Carlton fails to consider whether more financial value is accruing to PBM-affiliated pharmacies vs. non-affiliated pharmacies.
Consider, in addition to the points we raised in the last section, the idea that over time, generic drugs will get cheaper and cheaper (this is the observation of the FDA, but also what NADAC informs us of as well) and it is not hard to see why concerns may be focused less on prescription volume and more on prescription value. Putting it in yet a different light, if the major retail pharmacy locations are shuttering locations – as demonstrated by the announcements of Walgreens, Rite Aid, and even CVS (for its retail pharmacies) – what does that demonstrate about the long-term viability of dispensing traditional drugs (i.e., the non-affiliated retail pharmacies)? If the largest chains are unable to secure contracts that support the growth of their business, how is that not demonstrative of the challenge in evaluating where the value of prescription drugs actually lies. We know that the number of prescriptions filled each year is going up (not down). We believe this represents a pretty high demand for prescription drug dispensing, and yet why are the principal locations at which most drugs dispensed (retail pharmacies) going down (refer to the previously mentioned Benjamin Jolley’s work)?
Carlton Report Analysis #12: Claims that PBMs have inflated drug costs by the use of their affiliated pharmacies are not supported by the data on the overall payments of plan sponsors and members for all drugs.
The last claim evaluated by Professor Carlton was to evaluate whether there are inflated drug costs with the use of affiliated pharmacies in comparison to non-affiliated pharmacies. This section appears to be an attempt to directly contradict TFTCRTESWLDFTHB’s analysis of imatinib and abiraterone markups. We say this because Professor Carlton begins by stating, “The FTC interim report uses data on two drugs to claim that PBMs inflate drug costs at their affiliated pharmacies. Drawing conclusions from a sample of two drugs is inconsistent with a systematic economic analysis of all drugs. PBMs negotiate rates across thousands of drugs.” (If that is not an attempted direct refute, we’re not sure what is). While the Carlton Report appears to be a final report, his conclusion on this analysis is preliminary (at least it appears so), as he states, “preliminary analysis shows that overall payments for all drugs at affiliated pharmacies are roughly 4% lower than overall payments for the same drugs at non-affiliated pharmacies.“

Figure 17
Source: The Carlton Report
“The incentive is there for the PBMs and the specialty pharmacies to keep prices as high as possible.”
Interestingly, despite previously excluding specialty drugs from earlier analyses (for reasons unknown as already highlighted), here Professor Carlton is using “an expenditure-weighted average…on specialty and non-specialty drugs” to make his comparison. As we were just discussing, expenditures may not be equally weighted between the affiliated and non-affiliated pharmacy payments. However, looking closer it doesn’t appear Professor Carlton is looking at pharmacy payments for this analysis but plan and member payments.
Can you know to what degree plan and member payments were impacted by affiliated pharmacies by just looking at the plan and member costs (and not what the underlying pharmacy reimbursement was)? The claim being investigated is that PBM-affiliated pharmacies raised costs relative to non-affiliated. By measuring only that plan sponsor and member cost were unchanged based upon what they were charged (and not what the pharmacy was reimbursed), can you reasonably conclude that plan and members were not harmed? Wouldn’t it make sense to consider what the underlying reimbursement was to the pharmacy provider to make a judgement on whether plan sponsors were impacted by affiliated vs. non-affiliated relationships? Perhaps Professor Carlton feels this is an appropriate consideration given his aforementioned ‘spread’ analysis, but what if that 2% of observed spread (his own number) is concentrated in specialty pharmacy claims (or non-specialty claims). Would that not have an influencing role (i.e., confounding variable) on this assessment here (since plan payments would be skewed by the degree of spread)? His analysis is only finding a 4% delta, so 2% spread would seem a variable worth considering.
What is more is that Professor Carlton appears to be using fixing effects without any discussions on what those are and how they were accomplished (and why are PBM fixing effects necessary on an analysis measuring PBM-affiliated pharmacies?). As we already noted, a subset analysis to his report on the various roles of Medicare, Medicaid, and Commercial in his spread pricing assessment would seem of benefit (and likely could have informed why he had to make fixing effects to those markets for this analysis). To be clear, we’re not economists, but our understanding is the primary strength of fixed effects is the control of unobservable or unmeasurable characteristics that do not vary over time. Are we sure these effects haven’t varied without some of these subset analyses? Conversely, our understanding is the primary limitation of fixed effect analysis is unobserved heterogeneity due to unmeasured characteristics that do vary over time. Without these sub-analyses, we have no idea the degree of heterogeneity that may have existed within the data he had access to. Saying it differently, fixed-effects regression analysis would not make sense if the data is highly heterogeneous.
Alternatively, Professor Carlton was previously able to evaluate trends based upon whether a brand drug was rebated or not (regardless of formulary differences that may exist within and across PBMs). Why did Professor Carlton not seek to perform this same analysis not on all drugs, but rather just generic drugs or just specialty generic drugs, of which TFTCRTESWLDFTHB was specifically calling out (rather than the entire basket)? By looking at all drugs, we’re potentially overlooking cross-subsidization that may be occurring in the management of drug costs, where brand drugs are provided more cheaply at the expense of higher generic drugs costs. PBMs may be able to accomplish lower than market prices on brands for a variety of reasons, such as access to 340B contract pharmacy relationships, or unique fees available to PBM-affiliated pharmacies (the aforementioned City of Mesa PBM contract makes reference to “access fees, market share fees, rebates, formulary access fees, inflation protection/penalty payments, administrative fees and marketing grants [available] from pharmaceutical manufacturers, wholesalers and data warehouse vendors.“). Can the reasonableness of payment only be judged in the aggregate for plan and members, as Professor Carlton claims, or are there more factors that need considered?
We know how difficult it can be for certain pharmacies to access certain patients to fill their medications (see House Oversight Committee, TFTCRTESWLDFTHB, and reports from cancer clinics). When we prepared our 2021 report on Tecfidera (dimethyl fumarate), it was not lost upon us that it took over a year after the generic launched for the drug to have a reported NADAC price (first NADAC reported in October 2021, generic available in August 2020). As NADAC is a signal that represents retail pharmacies buying drugs for purposes of dispensing to customers, retail pharmacies across the country were not buying cheap generic Tecfidera, because, it would seem, they couldn’t secure access to customers to sell it to (i.e., expenditures didn’t exist and therefore would appear to be able to be factored into Professor Carlton’s analysis as he has constructed it). In essence, perhaps in order to properly assess the above analysis, we first must know whether there are drugs that are experiencing what would effectively be market foreclosure. Until that question is addressed and answered, attempting to quantify via an aggregate analysis whether there are pricing differences or not between affiliated and non-affiliated pharmacies on some equal-basis measure would seem to be a futile exercise.
“Just when you think you have the answers, I change the questions.” - Rowdy Roddy Piper
If you’ve read this far, you get it by now that there is some serious disconnect between the findings of the Carlton Report and a considerable amount of public-facing research and analysis that exists in the public domain (which, to be clear, much of which is from non-46brooklyn sources). But more so, the Carlton Report appears to evaluate themes that sound adjacent to industry controversies, yet semantics provide obvious opportunities to avoid them altogether.
As a broad example, we draw your attention to Nephron Research’s 2023 report entitled, “Trends in Profitability and Compensation of PBMs and PBM Contracting Entities.” While we would also love more detail from this report, we have a fond appreciation for one particular chart (Figure 18).

Figure 18
Source: Nephron Research
As you can see above, over time, the PBM and vertically integrated insurer model is changing substantially over time (i.e., variability over time). When the state of Ohio uncovered its $244 million spread pricing scheme back in 2018, we thought they’d build statues of us and the Columbus Dispatch reporters all over Columbus (not really; there are arguably better ideas for statues in Columbus). But when the state went to ban spread pricing, what they quickly learned was that it isn’t that simple. You plug one leak only to discover another as potentially sprung up.
The Nephron report is a great directional indicator of this challenge. When we helped uncover spread pricing back in 2017-2018, it was arguably peaking. Similarly, traditionally defined rebates were the most significant component of the PBM business model just years earlier, but were also seeing pressure as plan sponsor demands for those dollars grew and as Epi-Pen and insulin controversies swelled and evolved the public understanding of drug pricing’s true nature. But as scrutiny ramped up and plan sponsors pushed back amid both controversies, the dollars shifted. Fast forward to today, and the traditional ways the PBMs and their parent companies make money off of drug prices has materially shifted to the point where “the old ways of doing business” are becoming increasingly an afterthought.
While the bread was buttered in arguably more straightforward ways in the past, the increasing complexity has created new opportunities to shift dollars to newer and more hard-to-reach areas for researchers, regulators, and payors alike. We feel like this speaks to the complexity of the healthcare model as it stands today, the reality of why drug pricing studies can take so long to be concluded, and the importance of questioning the questions right out of the gate. Are you getting answers to the question you asked or the questions they want to answer?
When seeking answers, we must first judge the merit of the question asked
Over time we have come to appreciate how the manner in which we ask a question is arguably just as important as the answer we receive. If the above seems like a heavy, personal criticism of Professor Carlton, we well and truly do not mean it to be (we ourselves have faced criticisms related to our work studying drug pricing – there isn’t infinite time available to conduct a singular analysis – criticism comes with the territory). Rather, we’re attempting to demonstrate how the details and methods regarding how questions are asked and how questions are answered are just as important as the answers themselves, it not more so. Healthcare is undoubtedly a complex system, including the niche of prescription drugs.
Complex systems are characterized by behavior that is inherently challenging to model. As a result, complex systems and the interactions therein give rise to unique properties, including nonlinearity, emergence, spontaneous order, adaptation, and feedback loops, among others, that often are challenging to consider both individually and as part of the larger system itself.
In our view, one of the principal challenges in analysis of prescription drugs is how given the same set of data, very different conclusions can be reached. It is as a result of this observation, among other reasons, why we try to focus so much on showing our work with as much detail as possible (i.e., this is why we link to the data sources, build dashboards for users to draw their own conclusions, publish hundred-page reports through our consulting work, etc.).
As the Jedi masters of old taught, our eyes can deceive. Applying this learning to prescription drugs can be challenging, but nevertheless, we think it important to contextualize how the question was framed, just as much as understanding what answers resulted – otherwise what do you really know about what you’re being told?
“If you’re as transparent about drug pricing as you claim, why don’t you publish prices on your website?”
Nevertheless, it is not lost upon us how PBMs are so certain that they’re saving us all money that, among other things, they cannot show their individual drug prices (see health plans or pharmacies efforts), cannot put cost plus pharmacies into their retail networks (see Cuban Cost Plus pharmacy absence from all of the big three PBM pharmacy networks - even though we know some plan sponsors have asked the big 3 to include his pharmacy for their plan), and even delay coverage of cheaper biosimilar alternatives to expensive specialty drugs. Said differently, why aren’t PBMs rushing to provide all parties with an itemized receipt for what they’re being charged so no one doubts their savings? If things like TrueCost are the future, doesn’t that in some way acknowledge that we are currently – and have been – living in a false cost world?
At the end of the day, we think the lesson to learn here is that if you leave reform up to the courts, you never know what you’re going to get.